The Advocacy  Institute Logo
image Search   Contact UsDonatefacebookfacebook

 About UsProjectsServicesResourcesAdvocate AcademyAdvocacy in ActionHome page

image
improving the lives of people with disabilities

What is NAEP and Why is it important?

NAEP Results for Students with Disabilities :: National
2022-2019

NAEP Results for Students with Disabilities by State ::
2019 vs. 2022

NAEP Results for Students with Disabilities by Race/Ethnicity :: National 2022

NAEP Results for Students with Disabilities :: National
2019-2017-2015

NAEP Results for Students with Disabilities :: by State
2017-2015-2013

2022 NAEP Results for Students with Disabilities :: Rank-ordered by State

2019 NAEP Results for Students with Disabilities :: Rank-ordered by State

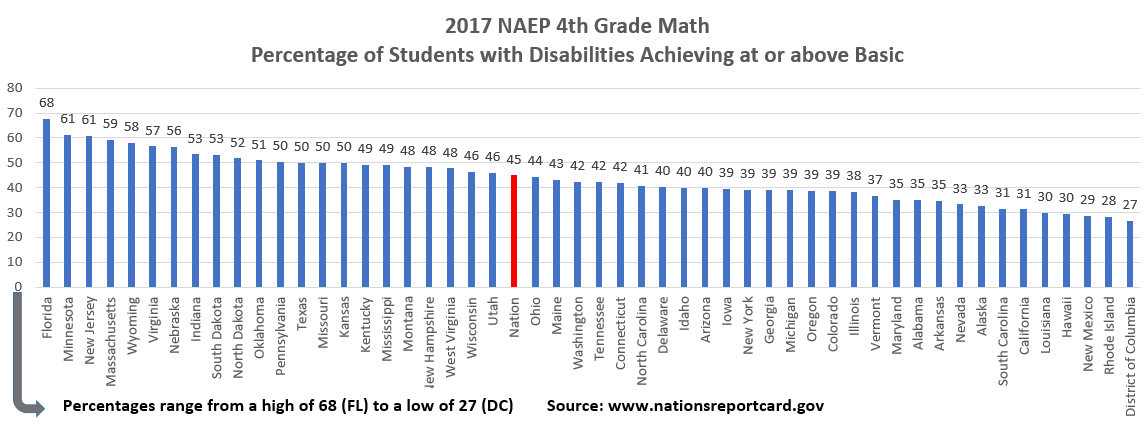
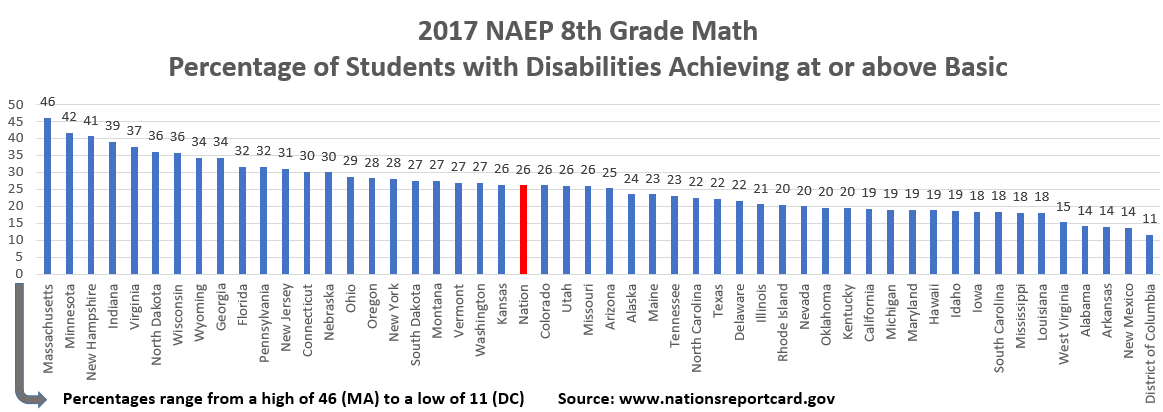
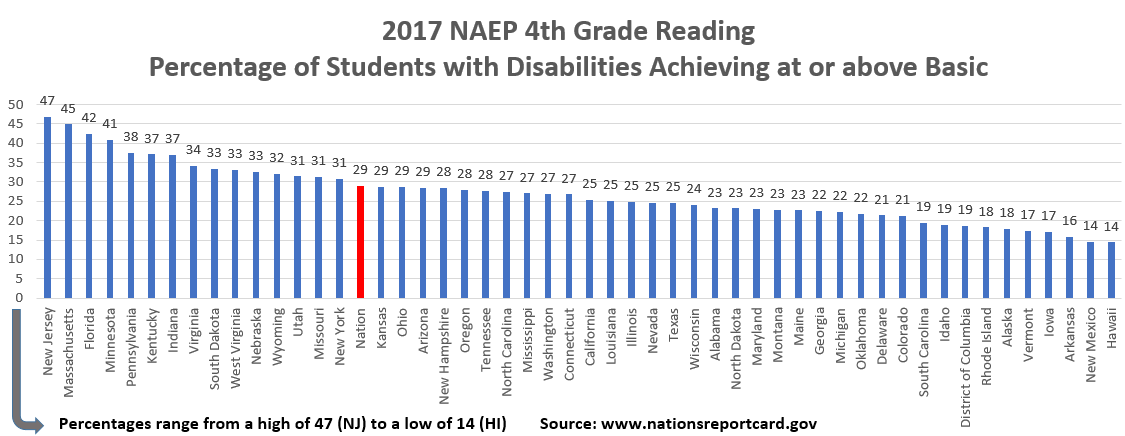
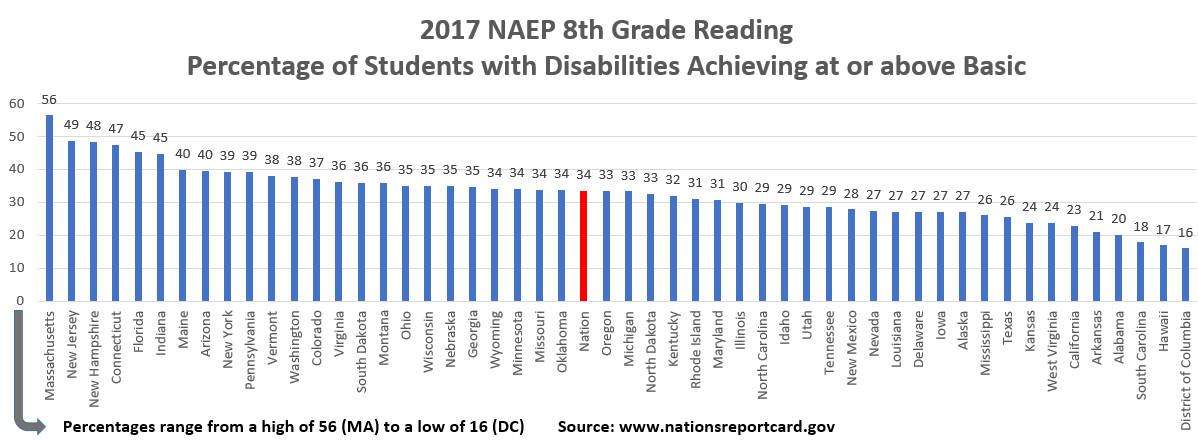
2017 NAEP Results for Students with Disabilities :: Rank-ordered by State


NAEP and Students with Disabilities

2017 National Assessment of Educational Progress (NAEP)
Performance of Students with Disabilities by State

Below is the percentage of students with disabilities (students with IEPs) scoring at Basic or above (e.g., Basic, Proficient, Advanced) on 4th and 8th grade math and reading.


MathGrade4 States at or above basic 2017

MathGrade8Statesatorabovebasic

Reading Grade 4 Students with Disabilities Basic and Above 2017

Reading Grade 8 Students with Disabilities Basic and Above 2017

Participation. Participation in NAEP is judged based on the percentage of the selected students with disabilities who took the assessment. States are rated satisfactory if participation is 85 percent or higher while states with rates below 85 percent are found to be unsatisfactory.

States with unsatisfactory participation rates in the 2017 NAEP appear below. These states are, however, listed by NAEP as having a rate higher than or not significantly different from the goal of 85% when taking into account standard error estimates.

Math Reading
4th Grade 8th Grade 4th Grade 8th Grade

California (83%)

Hawaii (84%)

Michigan (81%)

Texas (79%)


Hawaii (84%)

Louisiana (78%)

Texas (81%)


Georgia (82%)

Hawaii (83%)

Kentucky (82%)

Louisiana (84%)

Michigan (82%)

Texas (81%)


Georgia (80%)

Hawaii (83%)

Idaho (83%)

Kentucky (83%)

Louisiana (82%)

Maryland (84%)

Michigan (84%)

Tennessee (81%)

Texas (81%)


Sources: 2017 Reading and Math Grades 4 and 8 Assessment Report Cards: Summary Data Tables for National and State Sample Sizes, Participation Rates, Proportions of SD and ELL Students Identified, and Types of Accommodations available here.


About Us | Projects | Services | Resources | Advocacy in Action | Contact Us | Donate | Home

Copyright 2001-2024 The Advocacy Institute