What is NAEP and Why is it important?
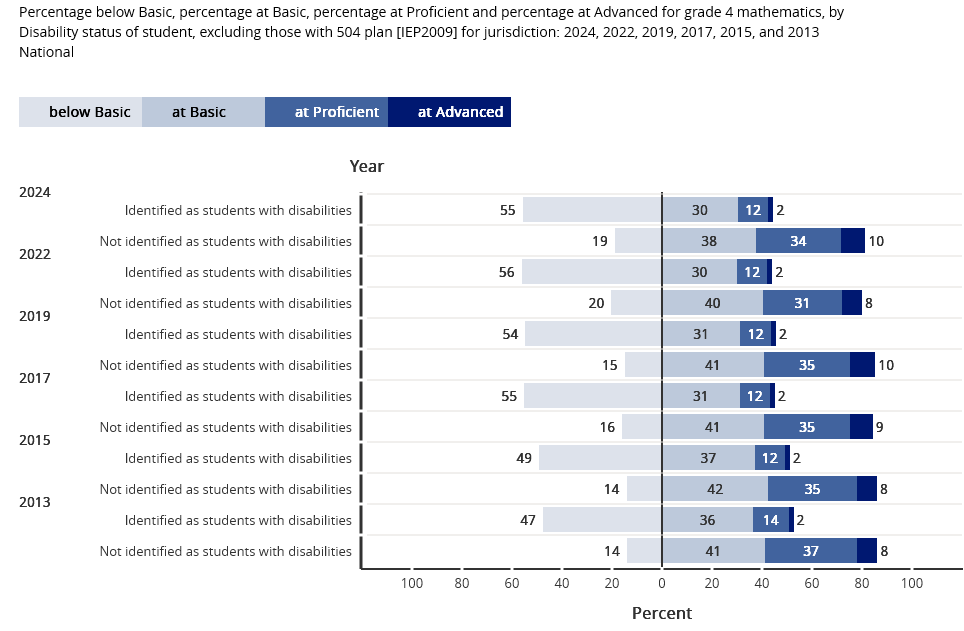
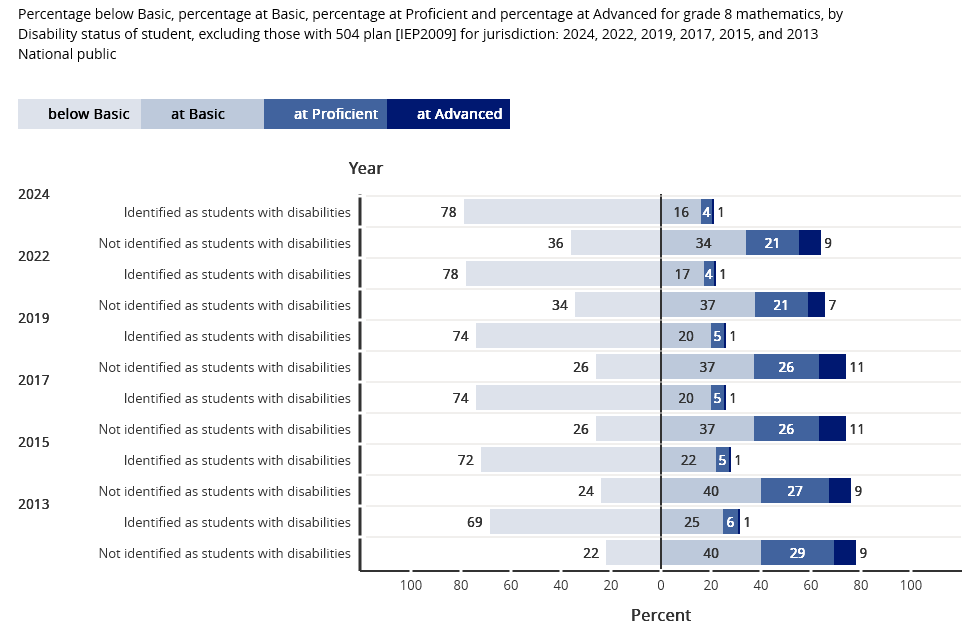
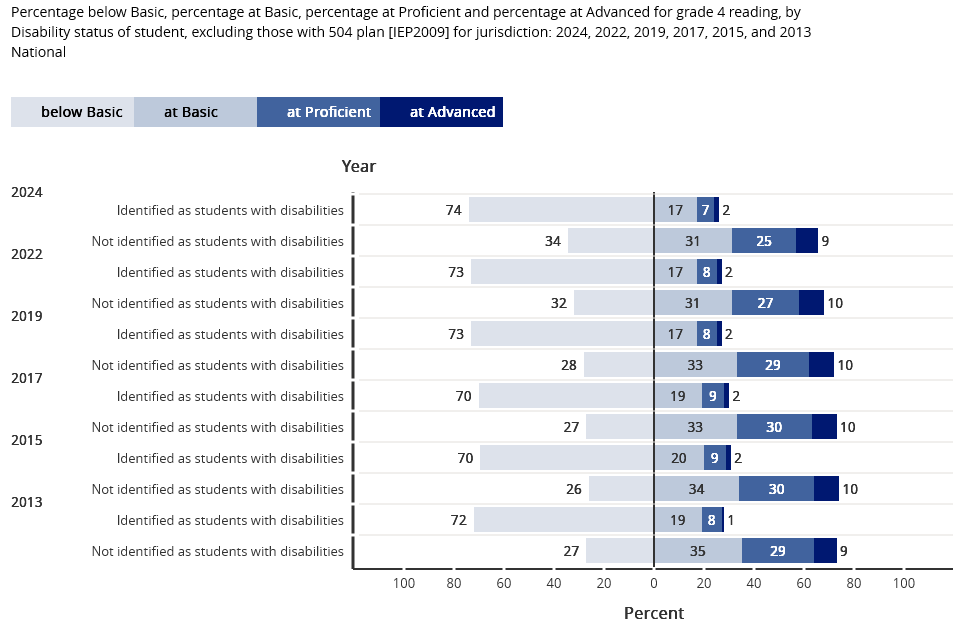
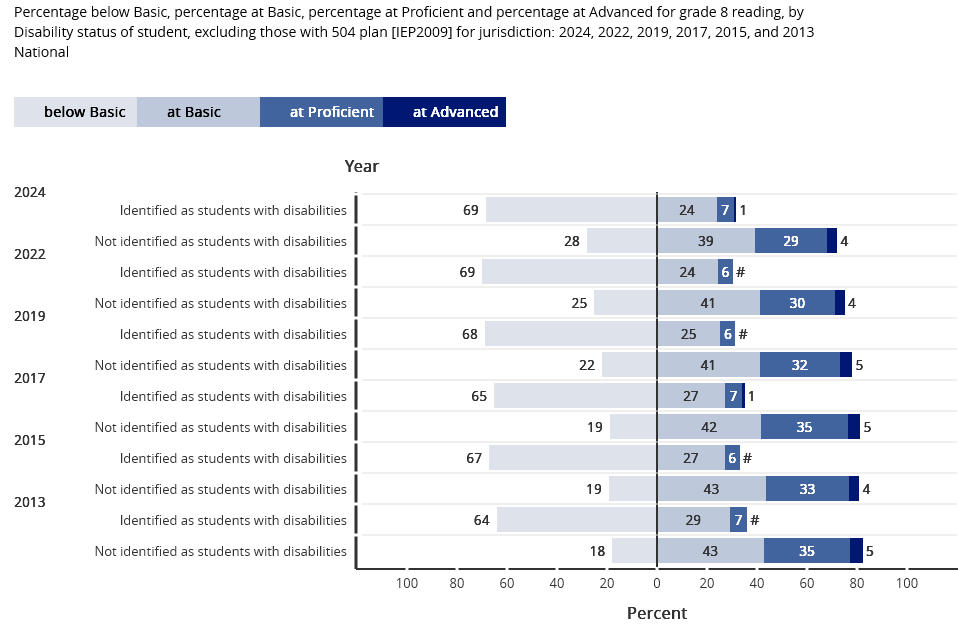
NAEP Results for Students with Disabilities :: National
2024, 2022-20192024 NAEP Results for Students with Disabilities :: Rank-ordered by State
|
||
|
|
|||||||
|
About
Us | Projects
| Services
| Resources
| Advocacy in Action
| Contact Us
| Donate
| Home
Copyright 2001-2025 The Advocacy Institute |