Archive for the 'Our Kids Count' Category

New Data: Number of IDEA eligible Students Ages 3-21 in 2020 Shows Little Change From 2019. Number of Infants and Toddlers Drops Significantly.

Tuesday, March 8th, 2022

The U.S. Dept. of Education has released new data on students with disabilities (eligible under the Individuals with Disabilities Education Act or IDEA). Section 618 of the Individuals with Disabilities Education Act (IDEA) requires that each state annually submit data about the infants and toddlers, birth through age 2, who receive early intervention services under Part C of IDEA, and children with disabilities, ages 3 through 21, who receive special education and related services under Part B of IDEA.

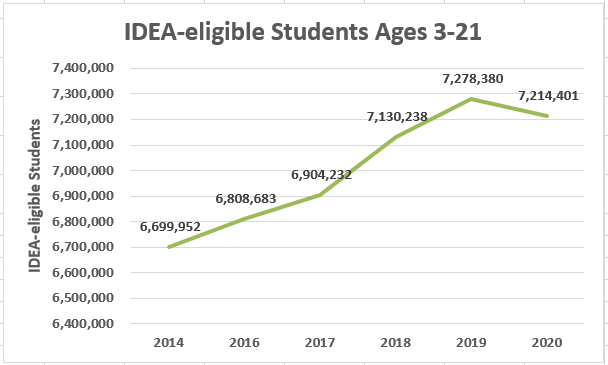
The new data – the first since start of the COVID-19 pandemic – shows the number of eligible children in 2020 remained essentially the same as in 2019, ending a steady stream of significant increases over prior years.

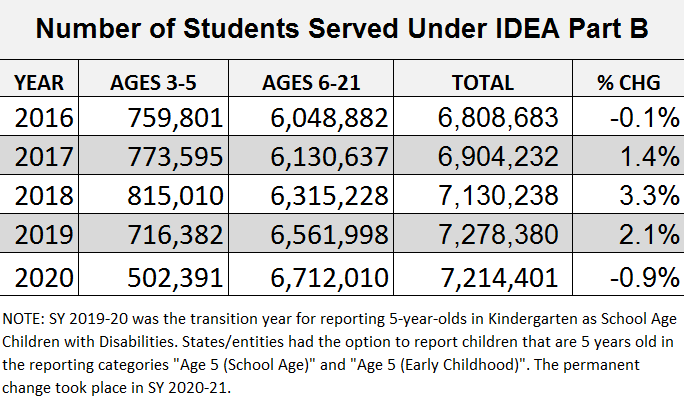
Because of a change in the way schools are to report children with disabilities who are 5 years old, the number of students in the 3-5 age range has declined and the number of “school age students” (formerly students ages 6-21) has increased. Beginning in 2020, schools were required to report 5 year olds in kindergarten as School Age Students with Disabilities. The chart below shows the impact of this change.

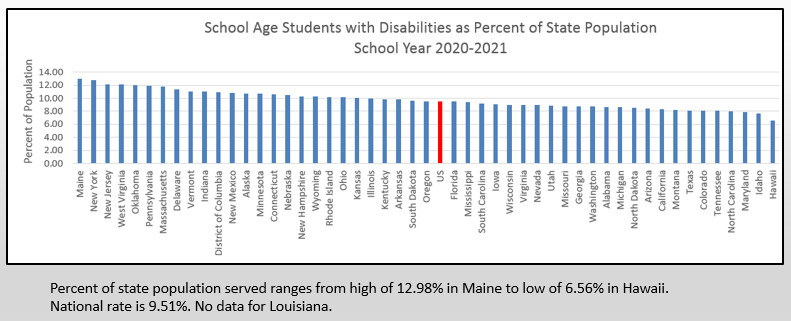
The percent of the population served continues to vary significantly across states, ranging from a high of 12.98% in Maine to a low of 6.56% in Hawaii

CHANGES IN DISABILITY CATEGORIES

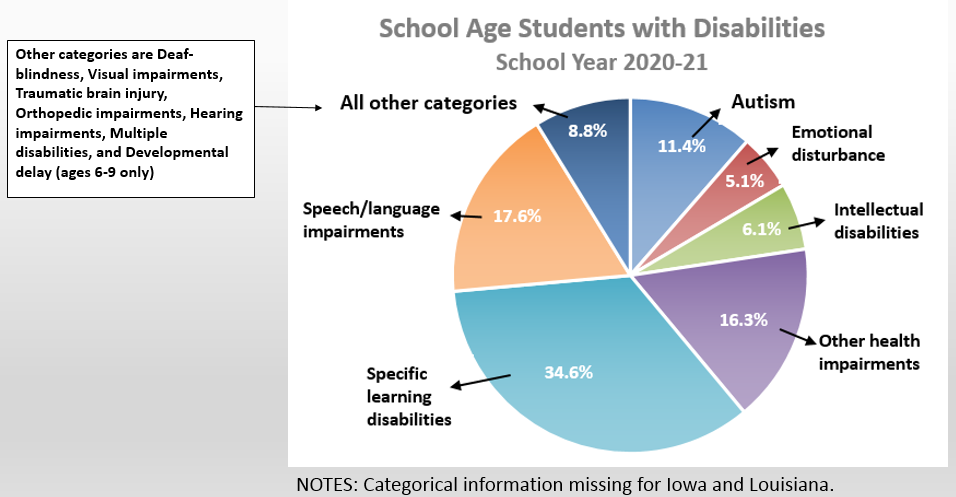
The distribution across disability categories of School Age Students with Disabilities in 2020 remained largely unchanged, with a slight increase in the number of children in the Developmental Delay category which is frequently assigned to students in the early grades. The Autism category continues to grow while other categories such as Specific learning disabilities and Speech/language impairments continue to decline.

NUMBER OF YOUNG CHILDREN DECLINES SIGNIFICANTLY

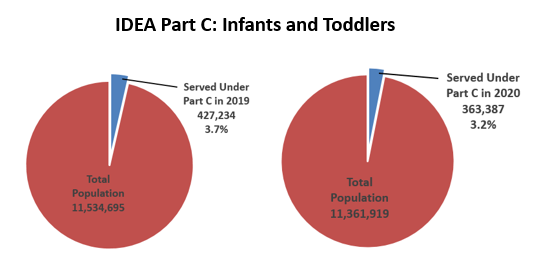
While the 3-21 group was unchanged, the number of children served under IDEA Part C saw a significant decline. The number of children (birth through age 2) declined by 63,847 or 15% from 2019 and the percent of population served fell from 3.7% to 3.2%. This decline is quite troubling and could reflect the impact of the COVID-19 pandemic on very young children including such things as foregoing regular check-ups which could recognize developmental delays.

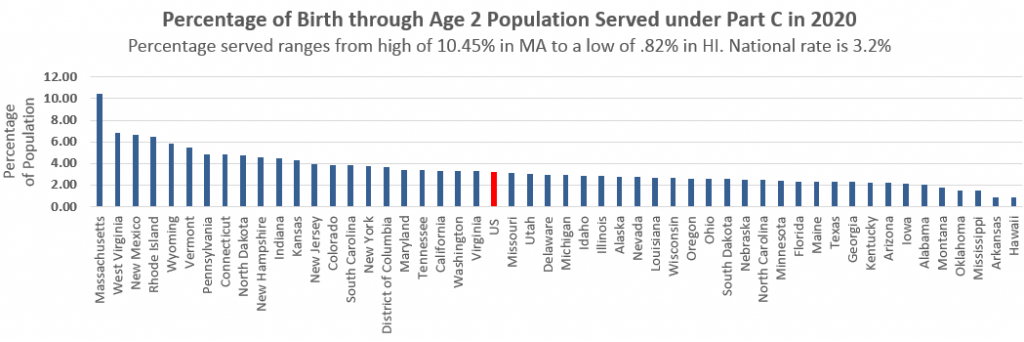
The percent of the zero to 3 population receiving early intervention services under IDEA Part C varies significantly across states, ranging from a high of 10.45% in Massachusetts to a low of .82% in Hawaii. All but 3 states (DC, SC, WY) reported drop in percent being served. See this table for change by state.


The section 618 data collection has been migrated to a new (very user- unfriendly) platform – the “Open Data Platform.

The new release provides data on the following:

· School Year 2019-20 Part B Assessment
· School Year 2020-21 Part B Child Count and Educational Environments
· School Year 2019-20 Part B Discipline
· School Year 2019-20 Part B Dispute Resolution
· School Year 2019-20 Part B Exiting
· Federal Fiscal Year 2019/ School Year 2019-20 Maintenance of Effort Reduction and Coordinated Early Intervening Services
· School Year 2019-20 Part B Personnel
· School Year 2020-21 Part C Child Count and Settings
· School Year 2019-20 Part C Dispute Resolution
· School Year 2019-20 Part C Exiting


American Rescue Plan Act Funds: New Opportunity for Assistive Technology!

Friday, October 15th, 2021

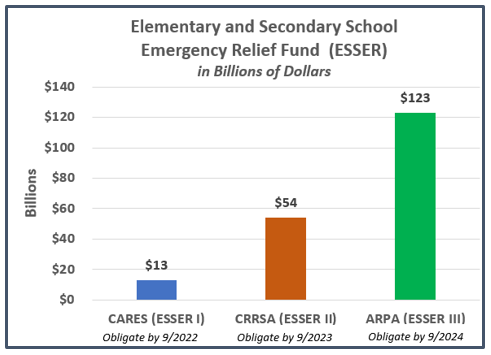
The American Rescue Plan (ARP) Act is the third and, by far the largest, federal law providing money to schools to assist with the impact of COVID-19 – known as the Elementary and Secondary School Emergency Relief or ESSER Fund. See graphic below.

The ARP provides $122.8 billion in ESSER funds.
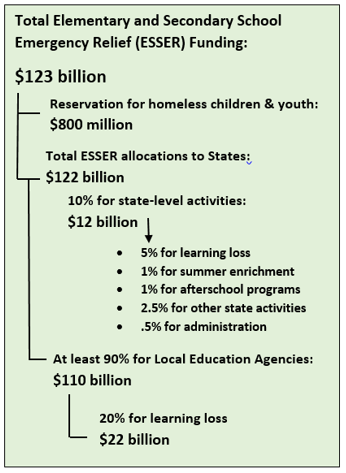
Allocations to states are based on the proportion that each state received under Title I, Part A of the Elementary and Secondary Education Act (ESEA) in the most recent fiscal year. Allocations for each state can be found in this State Allocation Table. Two-thirds of states’ allocations ($81.3 billion) were distributed to the states in late March 2021. The remaining one-third ($40.7 billion) is distributed after submission of a plan that describes how ARP ESSER funds will be used to safely return students to in-person instruction, maximize in-person instruction time, operate schools, and meet the needs of students, and that addresses other requirements of the ARP ESSER Fund. State plans are available here.

States must distribute at least 90 percent of their ESSER allocation to local educational agencies, or LEA also known as school districts. LEAs must spend a certain amount on specific activities as shown in the graphic below.

Each LEA is required to develop its ESSER plan in consultation with stakeholders and post the plan on its website.

Guidance from the U.S. Dept. of Education makes clear that ESSER funds can be used to address the assistive technology needs of students with disabilities. Here are some specifics:

Frequently Asked Questions
An LEA may use ESSER funds for the broad range of activities listed in section 18003(d) of the CARES Act, section 313(d) of the CRRSA Act, and section 2001(e) of the ARP Act including
– Any activity authorized by the Individuals with Disabilities Education Act (IDEA)
– Purchasing educational technology (including hardware, software, and connectivity) for students who are served by the LEA that aids in regular and substantive educational interaction between students and their classroom instructors, including low-income students and students with disabilities, which may include assistive technology or adaptive equipment. (Check out this WIRED article for recommendations on AT for students with dyslexia)

ESSER funds may also be used for:
– Improving the use of technology in the classroom and/or in a remote setting for children with disabilities to enhance learning;
– Software/online/virtual programs, screen capture/recording software, online/virtual cultural curriculum/programs, online/virtual tutoring curriculum/programs, learning management systems;
• Technology accessories, such as headphones, speakers, laptop cameras; and
• Assistive technology devices, such as dedicated communication devices and applications for text-to-speech, graphic organizers, or word prediction.
Additional U.S. Dept. of Ed documents with specific mentions of assistive technology for students with disabilities:

As the above document points out, it may be necessary to revise a student’s Individualized Education Program (IEP) in order to address new needs arising from lost instruction due to school closures and remote learning. Such a review/revision should include a consideration of the student’s need for assistive technology devices and/or services.

So …go for it, AT, that is! LEAs have several years to expend their ARP funds. Money should not be an issue when considering the need for AT.

Listen to this podcast with AT expert Dave Edyburn for a discussion of how ARP funds can be used for AT. And read Dave’s updated AT Advocacy article for tips on negotiating AT for students with disabilities.

How the States Stack Up: 2021 IDEA Determinations

Wednesday, June 30th, 2021

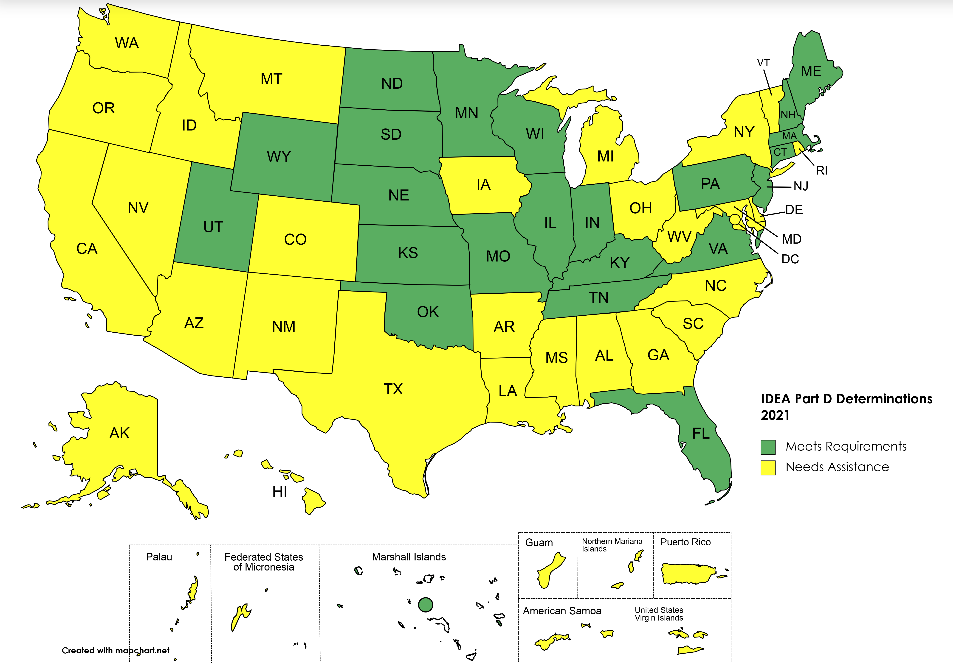
In June 2021 the U.S. Dept. of Education (ED) Office of Special Education Programs (OSEP) released the annual IDEA state determinations. The Individuals with Disabilities Education Act (IDEA) requires ED to annually assign every state a “rating” on its implementation of IDEA, based on the state’s performance on its State Performance Plan (SPP). The 2021 determinations are based on performance for fiscal year 2019. Each state is assigned one of the following ratings:
– Meets requirements and purposes of the IDEA Part B
– Needs assistance in implementing the requirements of IDEA Part B
– Needs intervention in implementing the requirements of IDEA Part B
– Needs substantial intervention in implementing the requirements of IDEA Part B

The map below shows the 2021 rating for each state. Based upon these ratings, 60 percent of the nation’s IDEA-eligible students are educated in states that “Need Assistance” in implementing the requirements of IDEA Part B.

The method for determining the rating is described in this document:
How the Department Made Determinations – Part B

Here is how to locate information for your state’s 2021 rating:
– Go to this page
– Locate your state’s 2021 SPP/APR Submission Part B and State Determination Letters PART B
– Click and download the MS WORD document of the 2021 SPP/APR Submission PART B
– Go to the end of the MS WORD document and click on the PDF icon that says “results matrix -2021b.” This document – titled “2021 Part B Results-Driven Accountability Matrix” – provides the scoring for each element of the matrix used to determine the state’s rating.

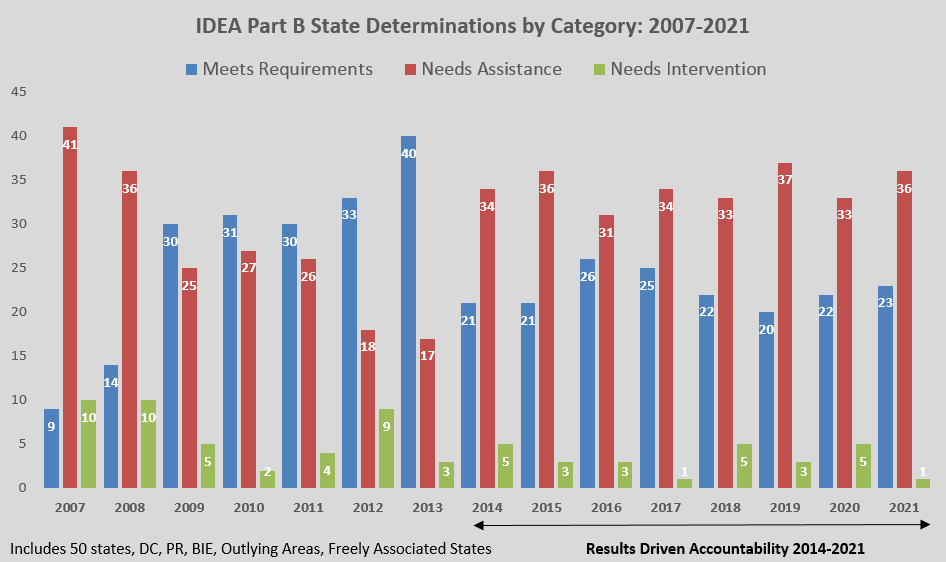
Beginning in 2014 OSEP began using the “Results-Driven Accountability” (RDA) Matrix to arrive at states rating. We have spent a great deal of time examining RDA. Our critique of the current RDA process is examined in depth in this report, “Results Driven Accountability Needs Substantial Intervention.” We discuss in detail what’s working and not working after several years of RDA-based state determinations. As the chart below shows, the number of states earning a “Meets Requirements” rating has not improved under RDA. Get ratings by state for 2014 to 2021 here. (PDF, 1 pg)

See also:
Federal Monitoring and Enforcement of IDEA Compliance, National Council on Disability, 2018


State-by-State Graduation Rates for Students with Disabilities :: 2018-2019

Thursday, April 1st, 2021

States are required to report annually to the U.S. Dept. of Education (ED) the “4-Year Adjusted Cohort Graduation Rate (ACGR)” for all students and separately for many student subgroups, including students with disabilities. The 4-Year ACGR for the 2018-2019 school year was released on March 22, 2021.

ABOUT THE ACGR: The ACGR was put into place in 2008 via Federal regulations to help bring uniformity to the way states calculate the high school graduation rate. Reporting began with the 2010-2011 school year. The ACGR was subsequently included in the Every Student Succeeds Act (ESSA) passed in 2015. It is also the subject of non-regulatory guidance released by ED in January 2017.

States are to report only those students who graduated with a “regular high school diploma” in four (or fewer) years. ESSA defines a “regular high school diploma” as the “standard high school diploma awarded to the preponderance of students in a State that is fully aligned with the State’s standards.”

The ED guidance makes these important points regarding the ACGR for students with disabilities:

  • A State may not include a recognized equivalent of a diploma as a regular high school diploma for the purpose of calculating the four-year or extended-year ACGR. (ESEA section 8101(43)(B)). Thus, students who graduate with a credential other than a regular high school diploma, such as a general equivalency diploma, modified diploma, certificate of completion, certificate of attendance, or a diploma based on meeting a student’s IEP goals, may not be counted in the numerator as having earned a regular high school diploma, but must be included in the denominator of the four-year and extended-year ACGR. (A-14, pg 13) A diploma based on meeting IEP goals will not provide a sufficient basis for determining that the student has met a State’s grade-level academic content standards; rather, it will only demonstrate that the student has attained his or her IEP goals during the annual period covered by the IEP. Therefore, a diploma based on attainment of IEP goals, regardless of whether the IEP goals are fully aligned with a State’s grade-level content standards, should not be treated as a regular high school diploma.(A-15, pg.13)
  • States may count a student with the most significant cognitive disabilities who graduates with a State-defined alternate diploma in the cohort for a four-year ACGR within the time period for which the State ensures the availability of a free appropriate public education under section 612(a)(1) of the Individuals with Disabilities Education Act (IDEA)(A-16, pg.13)

However, because the U.S. Congress invalidated the Federal regulations governing accountability under ESSA, some issues regarding the calculation of the ACGR remain unsettled. These include:

  • How states determine who is a “student with a disability” for inclusion in the subgroup. Therefore, states may be determining who is included in a variety of ways (started the cohort with an IEP, exited the cohort with an IEP, etc.) This lack of clarity impacts the comparability of the ACGR for students with disabilities across states.
  • How states count students with the most significant cognitive disabilities who graduate with a State-defined alternate diploma in the four-year and extended-year ACGR. Therefore, states may be using different methodologies for this purpose.

In comparing ACGRs across states, the substantial differences in the requirements for a regular high school diploma used by states must also be taken into consideration. A 2017 report by the National Center on Educational Outcomes examined the diploma options, coursework and exit exam requirements for students with IEPs compared to those without IEPs.  A regular high school diploma (as defined by ESSA) does not represent the same knowledge and skills across states nor does it necessarily indicate college and career readiness.

The ACGR plays an important role in the accountability plans that states were required to develop and implement as required by ESSA. States must set long-term goals and measurements of interim progress for the ACGR, including by student subgroups.

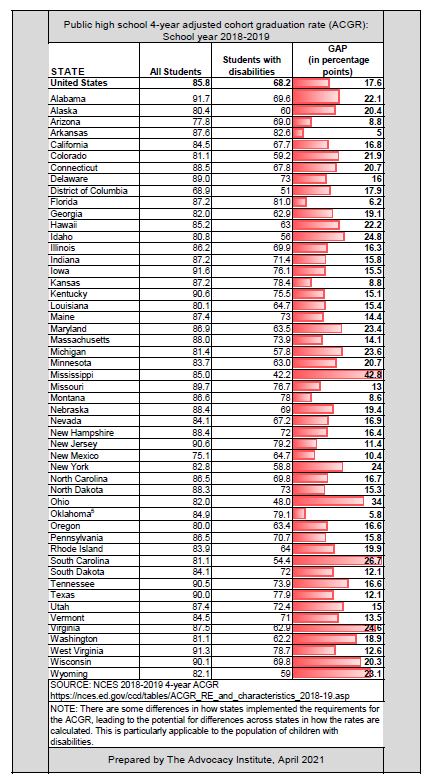
While ACGR comparisons across states are difficult due to the issues discussed above, what is worth scrutiny is the GAP between students with disabilities and all students on the 4-year ACGR within each state. The table below provides the GAP for 2018-19 by state. (Keep in mind that the GAP would be larger if it were possible to compare students with disabilities to those without disabilities.)
Download the chart (PDF)

4-year adjusted cohort graduation rate students with disabilities by state 2018-2019

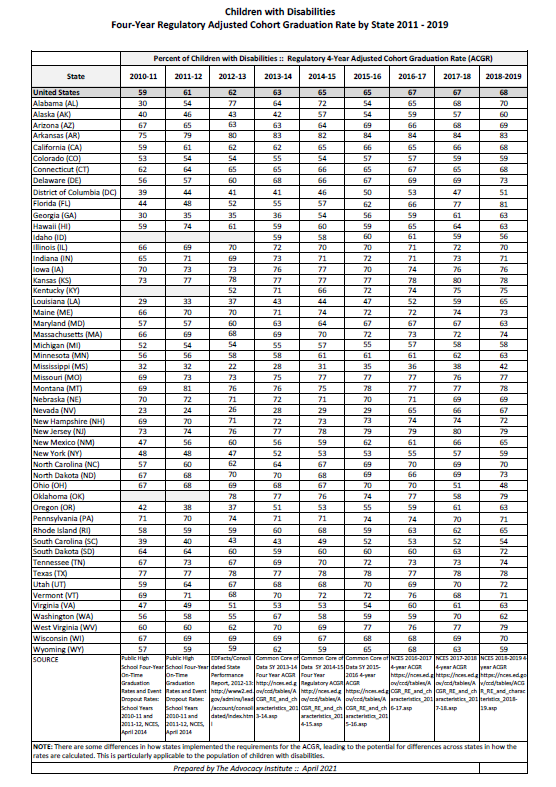
The chart below shows the performance of students with disabilities over the nine years since ACGR reporting began. Download the chart (PDF)

4-year adjusted cohort graduation rate for children with disabilities by state 2011-2019

See also:

State-by-state Graduation Rates for Students with Disabilities:
2017-2018
2016-2017
2015-2016

Diploma Options, Graduation Requirements, and Exit Exams for Youth with Disabilities: 2017 National Study (National Center on Educational Outcomes, 2019)

Diplomas that Matter: Ensuring Equity of Opportunity for Students with Disabilities (Achieve, 2016)

Almost all students with disabilities are capable of graduating on time. Here’s why they’re not (Hechinger Report, 2017)

Graduation Issues and Considerations for Students with Disabilities Webinar presented by The Advocacy Institute and the National Center on Educational Outcomes (archived recording) Webinar Handout (PDF)

Diplomas at Risk: A Critical Look at the Graduation Rate of Students with Learning Disabilities (2013)

What We Know about IDEA-eligible Students

Sunday, February 28th, 2021

This short presentation – just 10 minutes – provides an overview of the IDEA Section 618 data released in February 2021.

PowerPoint presentation (PDF, 14 pages)

Links in this presentation:
IDEA Section 618 data collection
Webinar: Finding and Using Section 618 Data

Happy Birthday, ESSA!

Thursday, December 10th, 2020

The Every Student Succeeds Act (ESSA) – the latest version of the Elementary & Secondary Education Act (ESEA) – turns FIVE YEARS OLD today, December 10, 2020.

The Act states clearly “The purpose of this title is to provide all children significant opportunity to receive a fair, equitable, and high-quality education, and to close educational achievement gaps.”  

So, five years in, let’s look at how students with disabilities are faring and if the achievement gaps are closing:

GRADUATION: The latest data on high school graduation rates showed no improvement for students with disabilities from the previous year. The 4-year adjusted cohort graduation rate gap between students with disabilities and all students remains at 18 points (67% vs. 85% respectively).

ACADEMIC ACHIEVEMENT: As measured by the National Assessment of Educational Progress (NAEP), the achievement of students with disabilities in reading and math at grades 4 and 8 has either remained flat or worsened. Meanwhile, the variance in NAEP achievement across states is astonishing.

PARTICIPATION IN STATE ASSESSMENTS: ESSA brought a new requirement regarding assessment participation – limiting the use of alternate assessments based on alternate academic achievement standards to 1% of all students assessed. Yet many states have requested a waiver to exceed this limit for multiple years. And the U.S. Dept. of Education has abandoned its responsibilities to require states to adhere to Federal regulations and most recently asked states exceeding the limit to submit improvement plans in lieu of formal waiver requests.

Meanwhile, several states fail to meet the ESSA requirement to include at least 95% of students with disabilities in their state academic assessments. Missing the test participation mark is the reason some states received a failing grade in IDEA implementation in 2020.

Significant lack of progress in these important indicators are even more critical when we consider the increase in the number of students identified for special education in recent years. The latest year with data available showed an increase of 185,000 students ages 6-21 (2017-18 to 2018-2019). So many more students are affected by the lack of impact of ESSA.

How the States Stack Up: 2020 IDEA Determinations

Thursday, October 1st, 2020

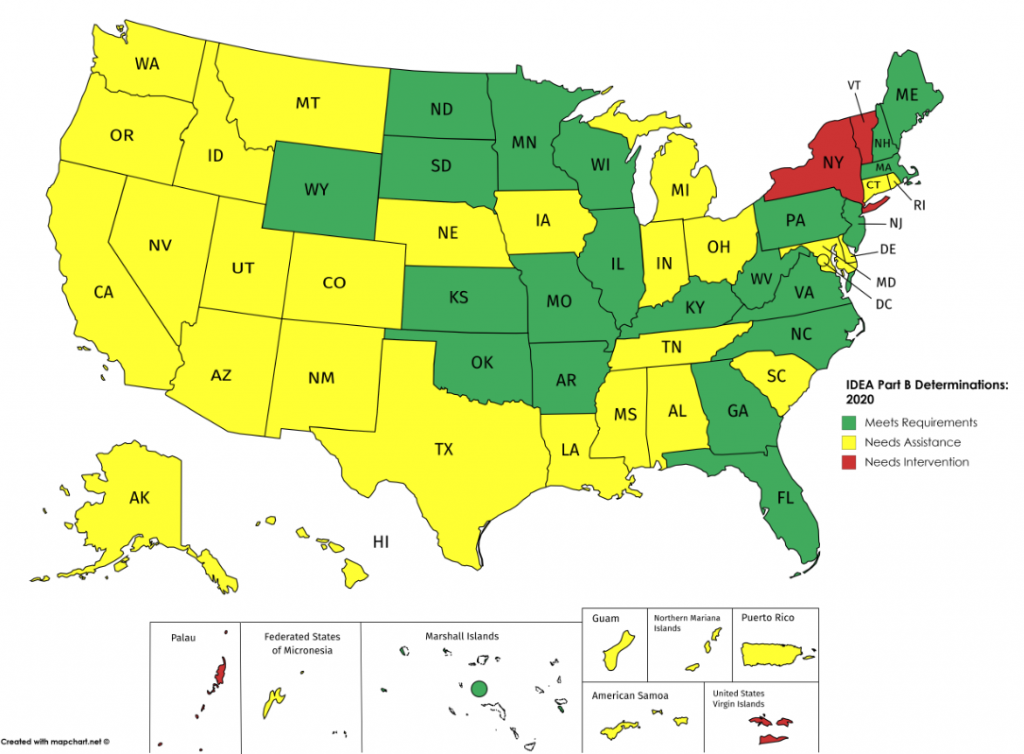
In June 2020 the U.S. Dept. of Education (ED) Office of Special Education Programs (OSEP) released the annual state determinations. The Individuals with Disabilities Education Act (IDEA) requires ED to annually assign every state a “rating” on its implementation of IDEA, based on the state’s performance on its State Performance Plan (SPP). The 2020 determinations are based on performance for fiscal year 2018. Each state is assigned one of the following ratings:
– Meets requirements and purposes of the IDEA Part B
– Needs assistance in implementing the requirements of IDEA Part B
– Needs intervention in implementing the requirements of IDEA Part B
– Needs substantial intervention in implementing the requirements of IDEA Part B

The map below shows the 2020 rating for each state.

The method for determining the rating is described in these documents:
IDEA Determinations Fact Sheet
How the Department Made Determinations – Part B

Here is how to locate information for your state’s 2020 rating:
– Go to this page
– Locate your state’s 2020 SPP/APR and State Determination Letters PART B
– Click and download the MS WORD document of the 2020 SPP/APR Submission PART B
– Go to the end of the MS WORD document and click on the PDF icon that says “results matrix 2020 part B.” This document – titled “2020 Part B Results-Driven Accountability Matrix” – provides the scoring for each element of the matrix used to determine the state’s rating.

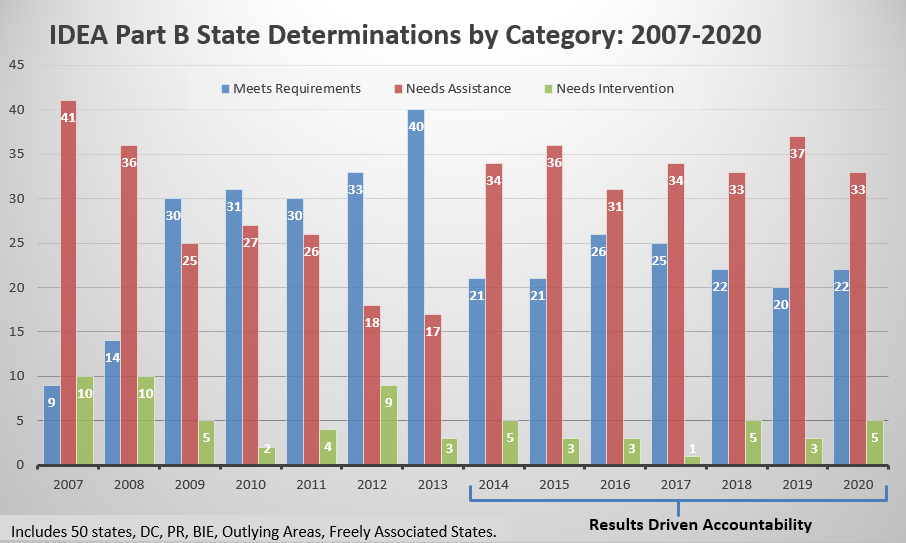
Now for the value of the “Results-Driven Accountability (RDA) Matrix. We have spent a great deal of time examining RDA. Our critique of the current RDA process, introduced in 2014, is examined in depth in this report, “Results Driven Accountability Needs Substantial Intervention.” We discuss in detail what’s working and not working after several years of RDA-based state determinations. As the chart below shows, the number of states earning a “Meets Requirements” rating has not improved under RDA. Get ratings by state from 2014-2020 here. (PDF, 1 pg)

While OSEP announced that it would make substantial changes to the RDA determinations process in the determination letters sent to states back in 2019 (see note below), ultimately the same process was used to make the 2020 determinations.

We continue to hope for substantial changes to RDA – changes that would result in improved outcomes for students with disabilities.

Stay tuned.

See also:
Federal Monitoring and Enforcement of IDEA Compliance, National Council on Disability, 2018

NB: The 2019 determination letters included this notice:

“The Secretary is considering modifying the factors the Department will use in making its determinations in June 2020 as part of its continuing emphasis on results for children with disabilities. Section 616(a)(2) of the IDEA requires that the primary focus of IDEA monitoring must be on improving educational results and functional outcomes for all children with disabilities, and ensuring that States meet the IDEA program requirements, with an emphasis on those requirements that are most closely related to improving educational results for children with disabilities.

The proposed Part B determinations process will include the same compliance factors as in past years, with one addition. For the 2020 determinations, rather than weighting each compliance factor equally, OSEP is considering assigning greater weight to those compliance factors most directly related to improving results for children with disabilities. For the 2020 determinations process we are also considering, as two additional results factors, State-reported data on: preschool child outcomes and the State Systemic Improvement Plan (SSIP). Using preschool outcomes for Part B determinations is consistent with the use of the early childhood outcomes factor that has been used for Part C determinations since 2015. Use of this factor emphasizes the importance of preschool outcomes in promoting later school success for students with disabilities. The inclusion of the SSIP as a results factor in making determinations would continue OSEP’s emphasis on incorporating a results-driven approach as States identify evidence-based practices that lead to improved outcomes for children and youth with disabilities. In addition, we are considering several changes to the results factors related to the participation and performance of children with disabilities on assessments, including: (1) using Statewide assessment results, rather than the NAEP performance data; (2) looking at year-to-year improvements in Statewide assessment results and taking into account the full Statewide assessment system, including alternate assessments; and (3) no longer comparing each State’s assessment performance with that of other States. Finally, OSEP will be revisiting ways of measuring improvement in the graduation rate of students with disabilities. As we consider changes to how we use the data under these factors in making the Department’s 2020 determinations, OSEP will provide parents, States, entities, LEAs, and other stakeholders with an opportunity to comment and provide input through OSEP’s Leadership Conference in July 2019 and other meetings.”


“Per Pupil Expenditures” Data and Special Education: What You Need to Know

Friday, September 18th, 2020

On September 16, 2020, the U.S. Dept. of Education (USED) launched a new website that shows how much money each school spends per student. Available at https://oese.ed.gov/ppe/ – the website provides an interactive map that displays the per pupil expenditure (PPE) data required by the Every Student Succeeds Act (ESSA) – the latest version of the Elementary & Secondary Education Act (ESEA) – on State and local report cards.

Many states on the USED map are missing PPE data, which states were required to start including in State and local report cards in the 2018-19 school year. The data may, however, be available on state dept. of ed websites.

This new requirement was intended to provide greater transparency to public school funding and allow parents and other interested parties to identify inequities across school districts and States.

However, as this Future Ed article, The Promise and Peril of ESSA School Spending Transparency, points out, school-level spending data is easily misinterpreted. Schools may receive greater funding because they enroll English language learners, special education students and others with learning needs that require additional resources. In fact, such schools could actually be receiving less funding.

It’s important to note that, unlike other student groups that need additional resources, students with disabilities are often placed in a school other than the school they would normally attend in order to provide specialized instruction. (These “placement” decisions are made by the student’s IEP team.) Thus, the PPE for a certain school may reflect spending on more special education students than would normally be attending that school.

But that’s just the beginning of why the PPE may be less than useful regarding special education. According to the USED guide, Opportunities and Responsibilities for State and Local Report Cards, released in September 2019, States have the discretion to allow LEAs to establish their own procedures for calculating per-pupil expenditures (see Q H-2). For example, one LEA may allocate special education expenditures to schools while other LEAs may keep all special education expenditures at the district level. Allowing LEAs to calculate PPE differently within a State essentially renders the data useless.

Information on how States calculate PPE, including whether all LEAs must follow the same calculation rules, should be available on the States’ department of education website, along with the annual report cards required by ESSA.

For example, this information from the Maine Dept. of Education clearly states that special education is not included in school level calculations while this information from the Wisconsin Dept. of Public Instruction clearly allows districts (LEAs) to pick and choose how they calculate PPE, including how they assign special education costs.

So, proceed with great caution when using the new PPE data!

MORE RESOURCES ON PPE:

Hechinger Report: New data: Even within the same district some wealthy schools get millions more than poor ones

Four Approaches to Assigning Costs to Central Levels vs. School Levels When Calculating Per-Pupil Expenditures (4 pgs, PDF)

ESSA Financial Reporting Requirement:
Three Action Steps to Build Equity
(1 pg, PDF)


State-by-State Graduation Rates for Students with Disabilities :: 2017-2018

Saturday, March 14th, 2020

States are required to report annually to the U.S. Dept. of Education (ED) the “4-Year Adjusted Cohort Graduation Rate (ACGR)” for all students and separately for many student subgroups, including students with disabilities. The 4-Year ACGR for the 2017-2018 school year was released on March 13, 2020.

ABOUT THE ACGR: The ACGR was put into place in 2008 via Federal regulations to help bring uniformity to the way states calculate the high school graduation rate. Reporting began with the 2010-2011 school year. The ACGR was subsequently included in the Every Student Succeeds Act (ESSA) passed in 2015. It is also the subject of non-regulatory guidance released by ED in January 2017.

States are to report only those students who graduated with a “regular high school diploma” in four (or fewer) years. ESSA defines a “regular high school diploma” as the “standard high school diploma awarded to the preponderance of students in a State that is fully aligned with the State’s standards.”

The ED guidance makes these important points regarding the ACGR for students with disabilities:

  • A State may not include a recognized equivalent of a diploma as a regular high school diploma for the purpose of calculating the four-year or extended-year ACGR. (ESEA section 8101(43)(B)). Thus, students who graduate with a credential other than a regular high school diploma, such as a general equivalency diploma, modified diploma, certificate of completion, certificate of attendance, or a diploma based on meeting a student’s IEP goals, may not be counted in the numerator as having earned a regular high school diploma, but must be included in the denominator of the four-year and extended-year ACGR. (A-14, pg 13) A diploma based on meeting IEP goals will not provide a sufficient basis for determining that the student has met a State’s grade-level academic content standards; rather, it will only demonstrate that the student has attained his or her IEP goals during the annual period covered by the IEP. Therefore, a diploma based on attainment of IEP goals, regardless of whether the IEP goals are fully aligned with a State’s grade-level content standards, should not be treated as a regular high school diploma.(A-15, pg.13)
  • States may count a student with the most significant cognitive disabilities who graduates with a State-defined alternate diploma in the cohort for a four-year ACGR within the time period for which the State ensures the availability of a free appropriate public education under section 612(a)(1) of the Individuals with Disabilities Education Act (IDEA)(A-16, pg.13)

However, because the U.S. Congress invalidated the Federal regulations governing accountability under ESSA, some issues regarding the calculation of the ACGR remain unsettled. These include:

  • How states determine who is a “student with a disability” for inclusion in the subgroup. Therefore, states may be determining who is included in a variety of ways (started the cohort with an IEP, exited the cohort with an IEP, etc.) This lack of clarity impacts the comparability of the ACGR for students with disabilities across states.
  • How states count students with the most significant cognitive disabilities who graduate with a State-defined alternate diploma in the four-year and extended-year ACGR. Therefore, states may be using different methodologies for this purpose.

In comparing ACGRs across states, the substantial differences in the requirements for a regular high school diploma used by states must also be taken into consideration. A 2017 report by the National Center on Educational Outcomes examined the diploma options, coursework and exit exam requirements for students with IEPs compared to those without IEPs.  A regular high school diploma (as defined by ESSA) does not represent the same knowledge and skills across states nor does it necessarily indicate college and career readiness.

The ACGR plays an important role in the accountability plans that states are required to develop and implement required by ESSA. States must set long-term goals and measurements of interim progress for the ACGR, including by student subgroups.

While ACGR comparisons across states are difficult due to the issues discussed above, what is worth scrutiny is the GAP between students with disabilities and all students on the 4-year ACGR within each state. The table below provides the GAP for 2017-18 by state.  (Keep in mind that the GAP would be larger if it were possible to compare students with disabilities to those without disabilities.)

Gap between all students and students with disabilities 2017-18 ACGR by state:


Download this chart (PDF)

The chart below shows the performance of students with disabilities over the eight years since ACGR reporting began.

SWD ACGR 2011-2018

Download this chart. (PDF)

NOTE: States reporting an ACGR more than 5 percentage points different (higher/lower) than the prior year for any subgroup are asked to provide an explanation for the increase/decrease to ED. Below are the explanations provided to ED by states with substantial increase/decrease in their ACGR for students with disabilities from 2016-17 to 2017-2018 (excerpted from the ACGR Data Notes at https://www2.ed.gov/about/inits/ed/edfacts/data-files/index.html#acgr). LEA and school level ACGR data are also available.

District of Columbia (-6): DCPS reported a lower graduation rate in SY 2017-18 compared to SY 2016-17; this change drove much of the observed state-level changes as DCPS students comprise approximately half of all DC students.

Florida (+11): The data reflect ongoing efforts by Florida to raise its graduation rate across all subgroups.

Louisiana (+7): Louisiana has shown growth in the overall state grad rate and made significant strides with these specific subgroups. In general, Louisiana’s overall cohort graduation rate increased over this period, with subgroups outpacing the average. In particular, Louisiana has increased its support and resources for high schools to serve historically disadvantaged groups of students.

New Mexico (+5): State indicated that data were correct as reported.

Ohio (-19): A change in business rules – due to ESSA – regarding the assignment of students to the HOM, LEP and CWD subgroups changed in SY 2017-18. These subgroups became an “if ever” subgroup in SY 2017-18 changing from a student’s status as of graduation as in previous years. This change in business rules affects the number of students both counted as graduates and non-graduates which resulted in changes to the subgroups graduation rate.

Vermont (-8): No response

Washington (+11): No response

Wyoming (-5): No response

See also:

State-by-state Graduation Rates for Students with Disabilities:
2016-2017
2015-2016

Diploma Options, Graduation Requirements, and Exit Exams for Youth with Disabilities: 2017 National Study (National Center on Educational Outcomes, 2019)

Diplomas that Matter: Ensuring Equity of Opportunity for Students with Disabilities (Achieve, 2016)

Almost all students with disabilities are capable of graduating on time. Here’s why they’re not (Hechinger Report, 2017)

Graduation Issues and Considerations for Students with Disabilities Webinar presented by The Advocacy Institute and the National Center on Educational Outcomes (archived recording) Webinar Handout (PDF)

Diplomas at Risk: A Critical Look at the Graduation Rate of Students with Learning Disabilities (2013)


2019 NAEP: Poor Performance of Students with Disabilities Continues

Wednesday, October 30th, 2019

Results of the 2019 National Assessment of Educational Progress (NAEP) in mathematics and reading were released October 29, 2019. Details are available here.

NAEP mathematics and reading assessments are given every two years to a nationally representative sample of students in fourth and eighth grades. NAEP provides an important comparison across states and between student groups (e.g., Black students, Hispanic students, students with disabilities, English learners).

Below are the national results for students with disabilities (IEPs only) compared to students without disabilities (public schools) for the most recent 3 NAEP administrations (2019, 2017, 2015).

In 2019 performance in math at grades 4 and 8 was unchanged while performance in reading at grades 4 and 8 worsened.

MATH GRADE 4

NAEP Math Grade 4 2019-2017-2015


MATH GRADE 8

NAEP Math Grade 8 2019-2017-2015

READING GRADE 4

NAEP Reading Grade 4 2019-2017-2015

READING GRADE 8

NAEP Reading Grade 8 2019-2017-2015