2015 NAEP Shows Little Change for Students with Disabilities
Results of the 2015 National Assessment of Educational Progress (NAEP) in Reading and Mathematics were released October 28, 2015. Details are available here.
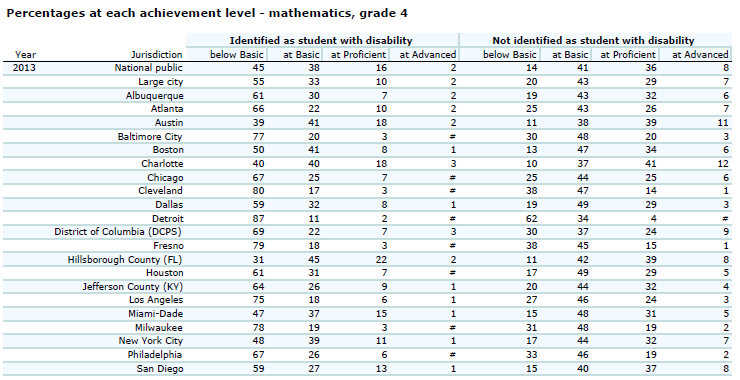
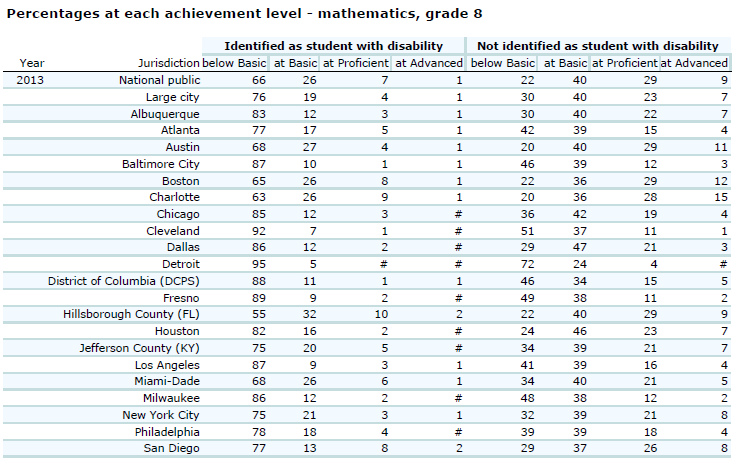
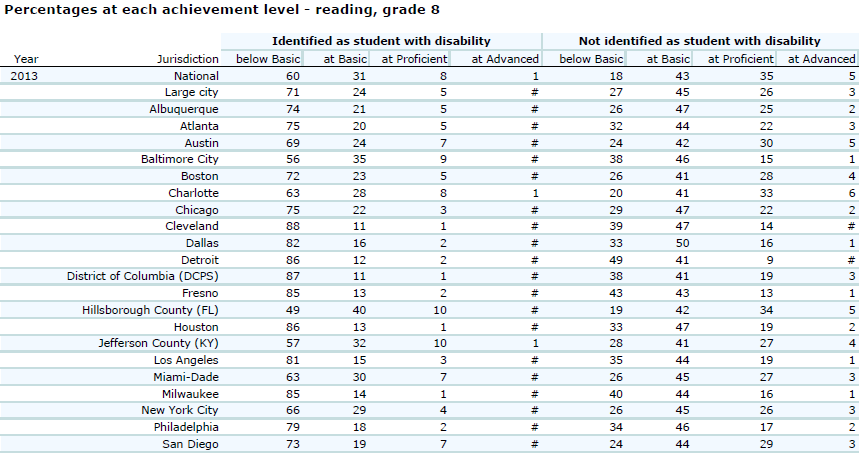
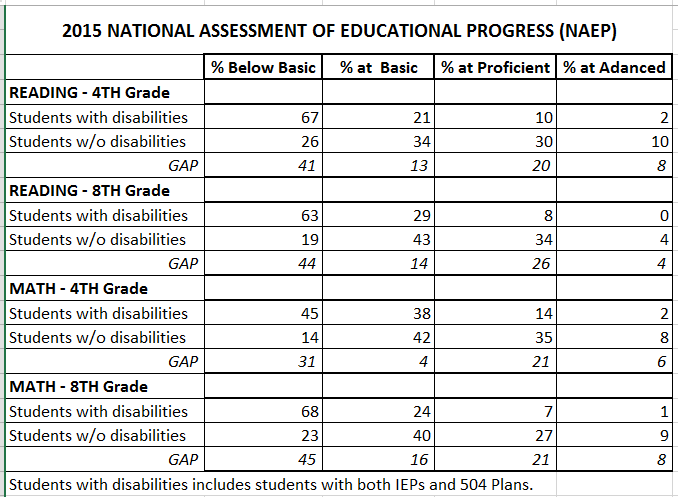
As in recent years, the 2015 performance of students with disabilities showed little if any improvement over the last three administrations (2009-2011-2013) and the gaps between students with disabilities and those without disabilities continue to be substantial. The majority of students with disabilities performed in the “below basic” achievement level in all areas except 4th grade Math. See table below.
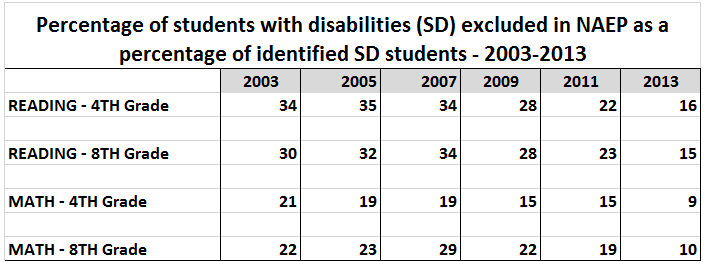
However, there has been a substantial improvement in the rate of exclusion of students with disabilities, i.e., the percentage of students with disabilities selected to participate in the sample who were not tested. This practice was addressed by a resolution of the National Assessment Governing Board in 2010. The resolution sought to have students with disabilities participating at a rate of at least 85% in every state. As a result, exclusion rates have plummeted, as shown in the table below. This high rate of participation makes the NAEP results for students with disabilities more representative of the group as a whole. (Details on exclusion rates by state on each NAEP assessment are available here.)
NAEP participation was also addressed by the US ED Office of Special Education Programs in 2014 when it began including NAEP participation and performance in the determination for each State under section 616(d) of the Individuals with Disabilities Education Act (IDEA).
The table below shows the rates of exclusion in NAEP administrations from 2003-2015.

In fact, the significant improvement in testing students with disabilities was noted by U.S. Education Secretary Arne Duncan as possibly causing overall declines in Maryland, as reported in the Baltimore Sun “U.S. Secretary of Education Arne Duncan noted to Maryland and Baltimore’s large declines, but said the drops were “good news” because they reflected the state’s efforts to be more inclusive of certain populations — such as students with disabilities and English Language Learners.”
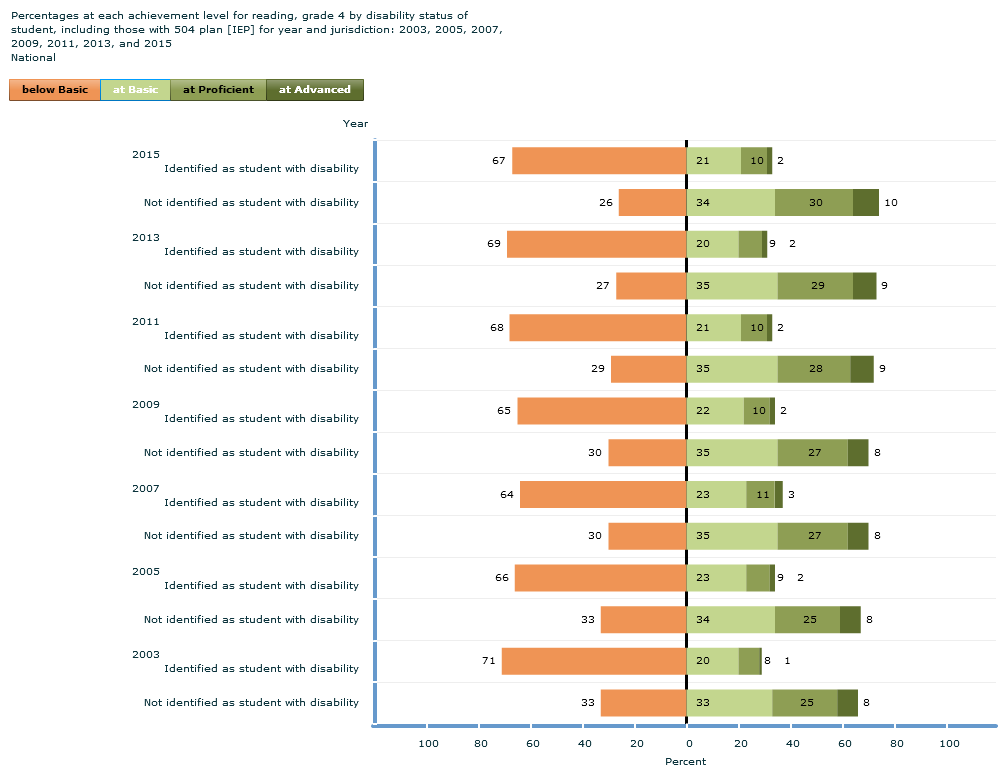
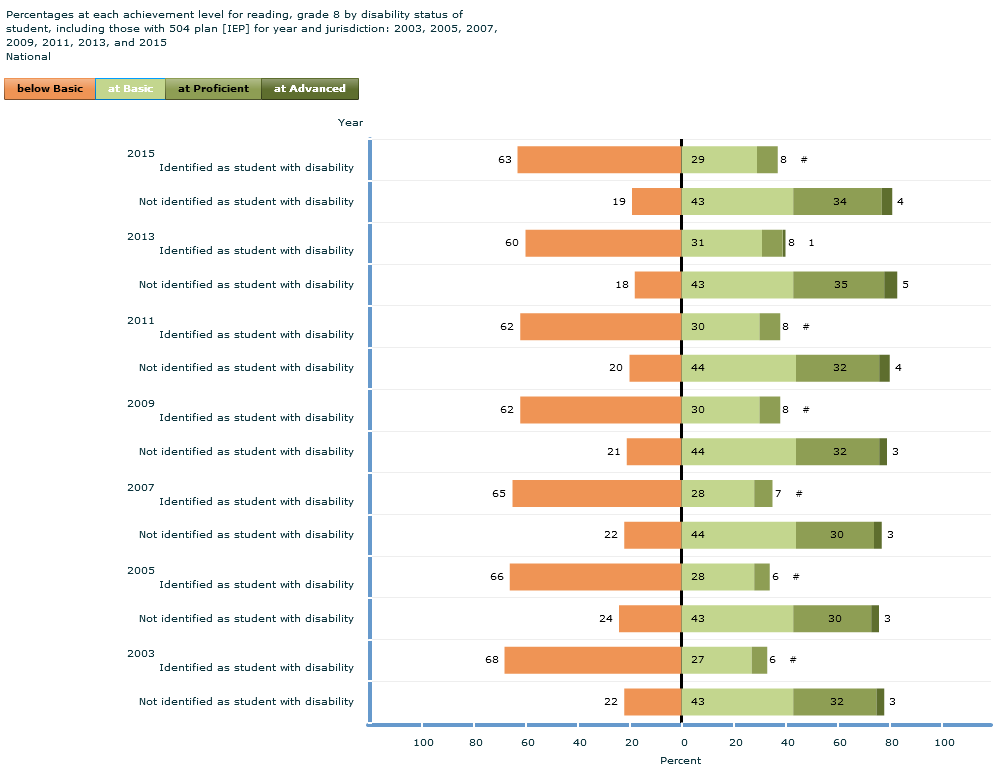
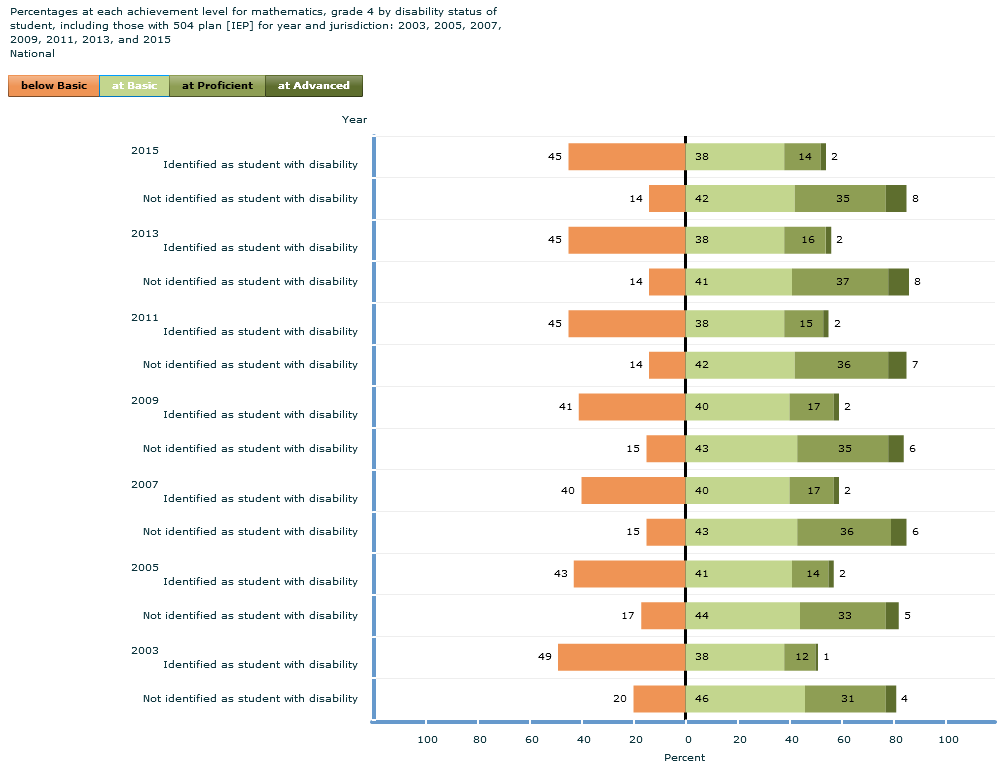
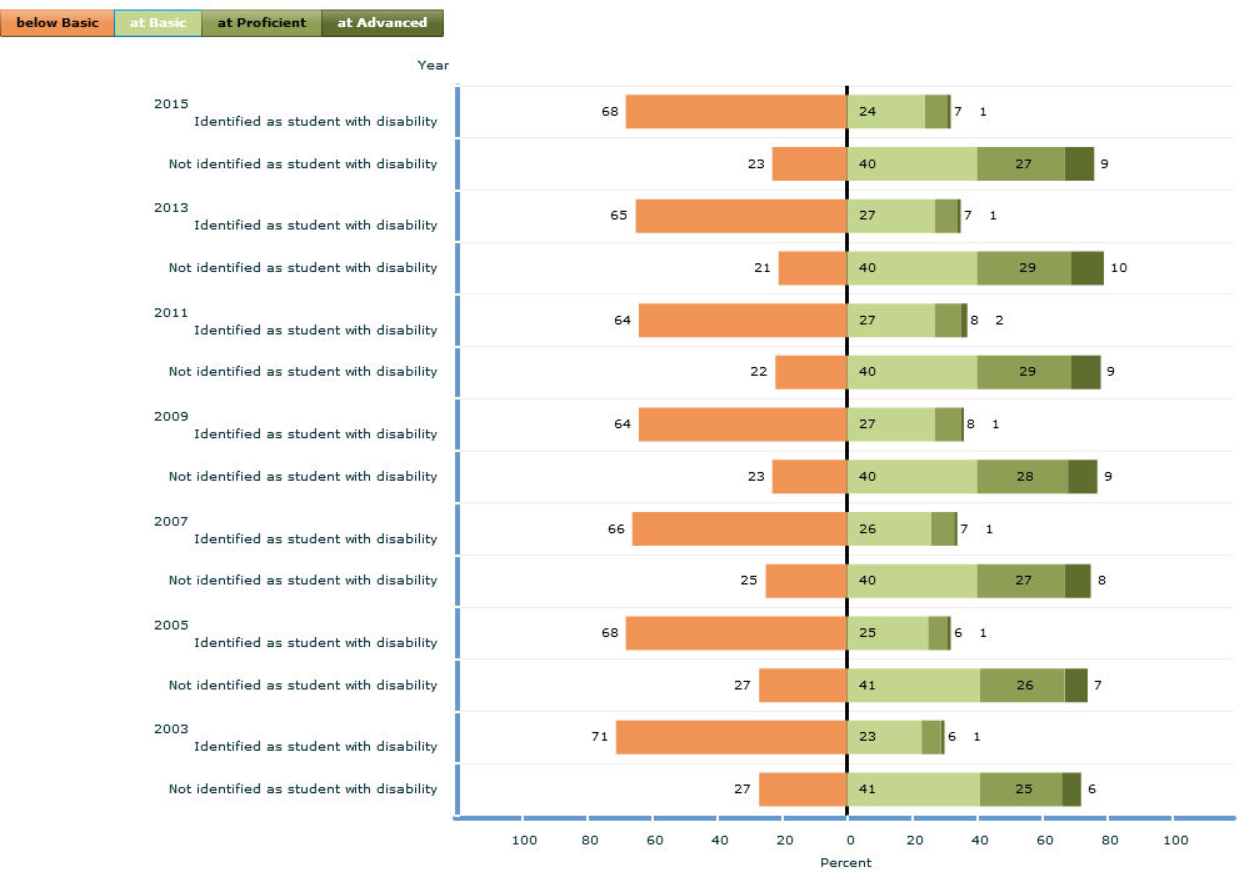
Below are achievement levels for students with disabilities and students without disabilities in each NAEP area from 2003 through 2015.
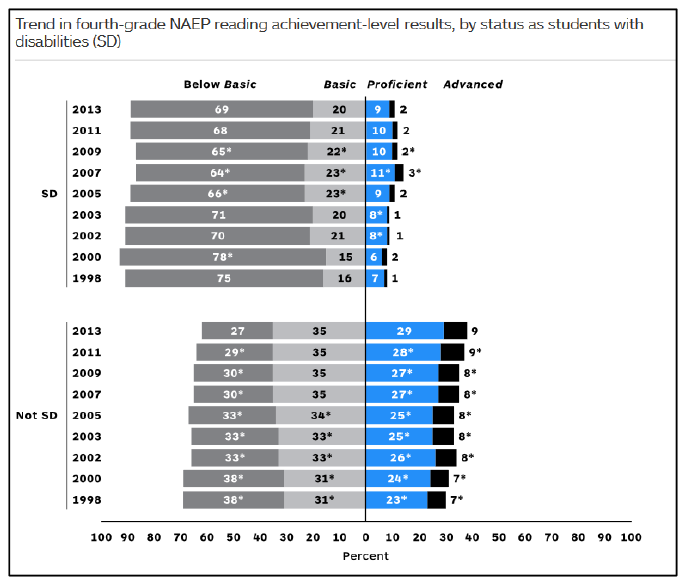
READING – GRADE 4
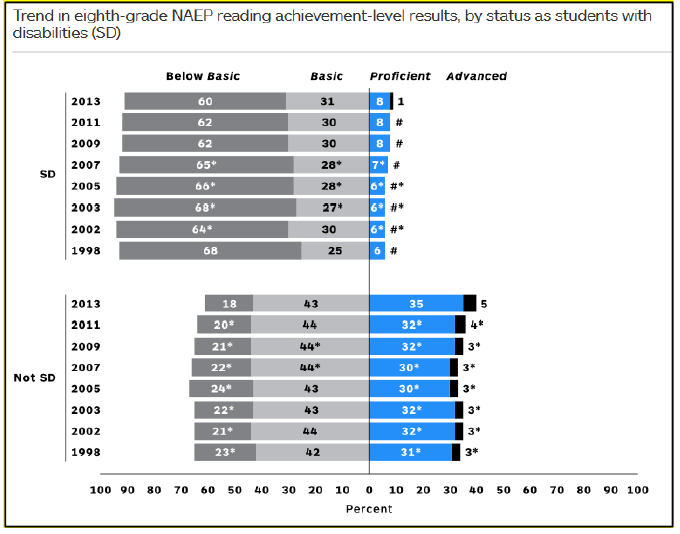
READING GRADE 8
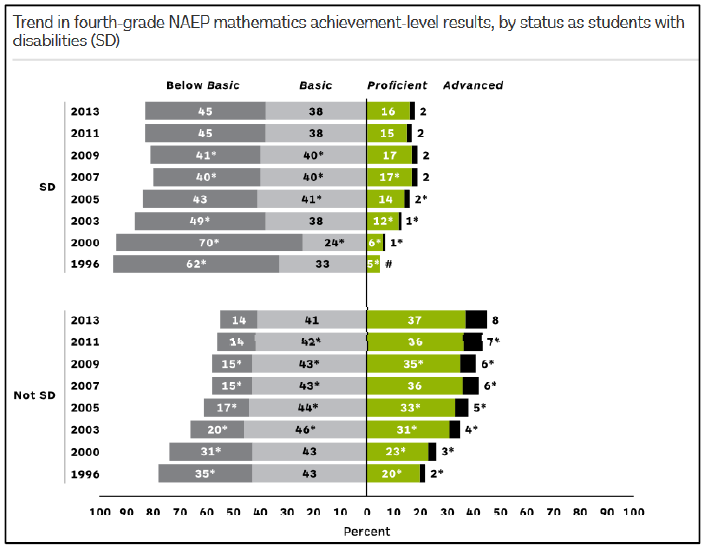
MATH GRADE 4
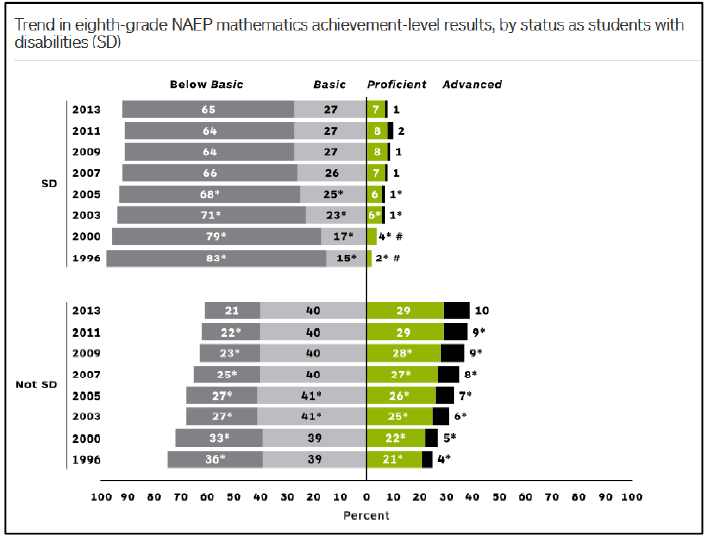
MATH GRADE 8
See also: Our reports on 2015 TUDA and 2013 NAEP results.