Number of School Age IDEA-eligible Students Increases 3 Percent in 2022
February 28, 2024
The U.S. Dept. of Education has released new data on students with disabilities (eligible under the Individuals with Disabilities Education Act or IDEA). Section 618 of the IDEA requires that each state annually submit data about the infants and toddlers, birth through age 2, who receive early intervention services under Part C of IDEA, and children with disabilities, ages 3 through 21, who receive special education and related services under Part B of IDEA.
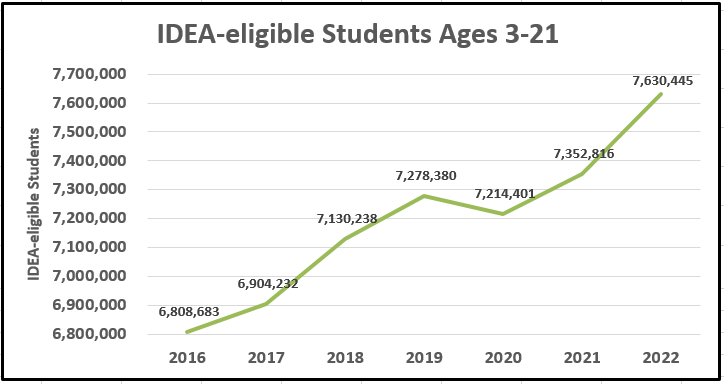
The new data show the number of IDEA-eligible children in 2022 increased significantly from 2021, which also showed a 2% increase. There was a slight decline in 2020.
Students ages 3-21 increased by 3.8% (an additional 277,629 students over 2021, totaling 7,630,445) which breaks down as follows:
- students ages 3-5 (not in kindergarten) increased by 13.6% (additional 64,015 students, totaling 535,392)
- school age students (ages 5 in kindergarten to 21) increased by 3%, topping 7 million for the first time (additional 213,614 students, totaling 7,095,053).
PERCENT OF ENROLLMENT
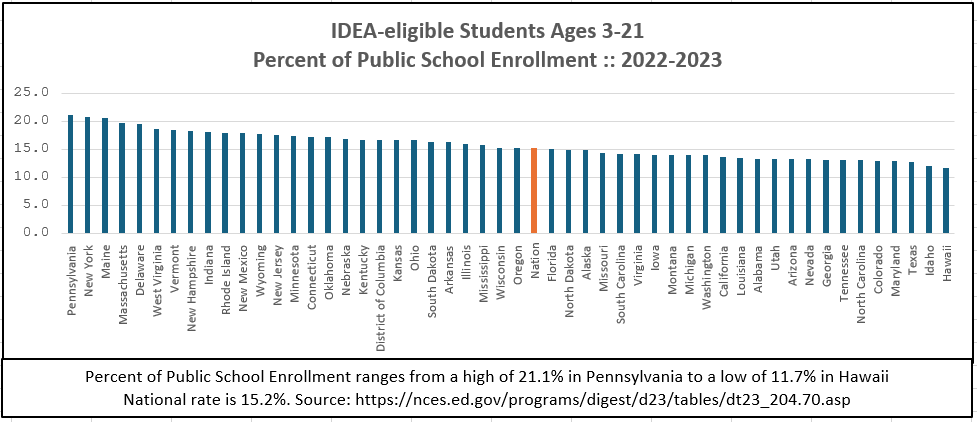
The percent of public school enrollment served under IDEA varies significantly by state as the table below shows. While the national rate is 15.2%, state rates range from a high of 21.1% in Pennsylvania to a low of 11.7% in Hawaii. Data source is available here.
The number of IDEA-eligible students ages 3-21 as a percent of public school enrollment has increased steadily over the past 5 years, going from 14.1% in 2019 to 15.2% in 2023.

CHANGES BY STATE
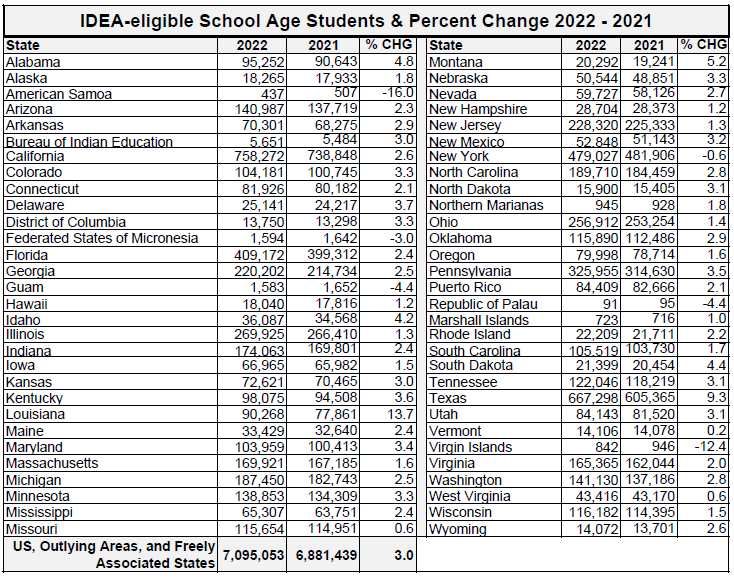
Changes from 2021 in state-level rates of school age students range from a high of 13.7 percent in Louisiana to a low of just .6 percent in Missouri and West Virginia.
DISTRIBUTION BY RACE AND ETHNICITY
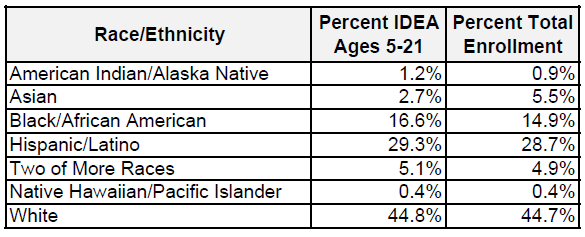
The representation by race and ethnicity of students with disabilities ages 5-21 compared to total school enrollment shows significant under-representation of Asian students, significant over-representation of Black/African American students and slight over-representation of Hispanic/Latino students.
CHANGES IN DISABILITY CATEGORIES
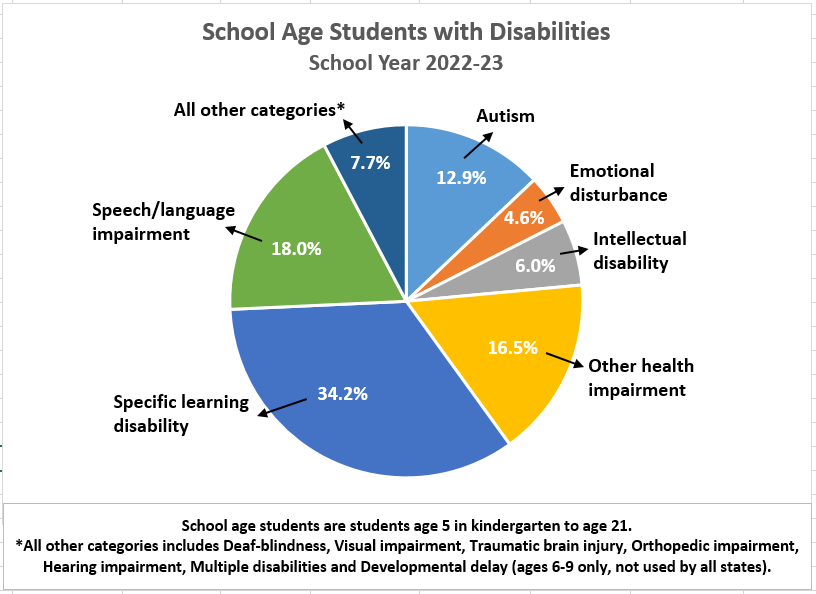
The distribution across disability categories of School Age Students (ages 5 (in kindergarten) to 21) with disabilities in 2022 showed an increase in the Autism category while other categories remain unchanged. Autism now accounts for nearly 13% of school age students with disabilities, up from 10% just 5 years ago.
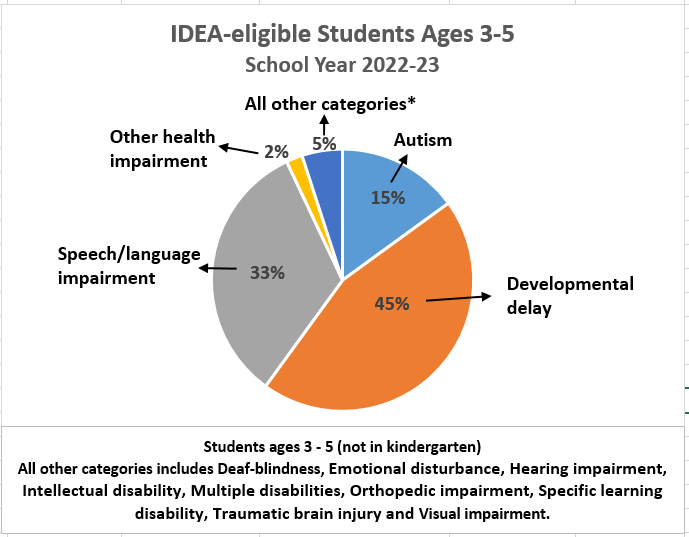
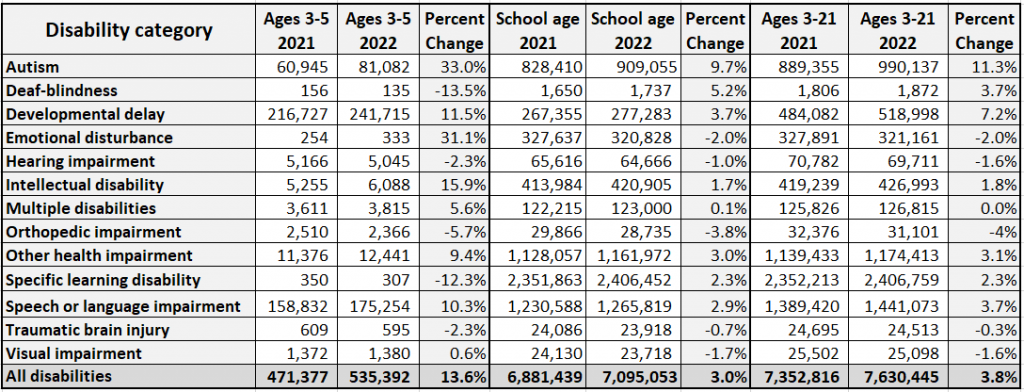
2021 – 2022 changes by disability categories (see table below) show a significant increase in Autism and Developmental delay.
NUMBER OF YOUNG CHILDREN (ages birth through age 2) ALSO SHOWS LARGE INCREASE
The number of children served under IDEA Part C (birth through age 2) also increased in 2022, to 441,515, an increase of 8.7% over 2021.
The race/ethnicity of children served under IDEA Part C is White 48.2%, Hispanic/Latino 28.8%, Black/African American 13.0%, Asian 4.2%, Two or more races 4.9%, American Indian/Alaska Native .62% and Native Hawaiian/Pacific Islander .29%.
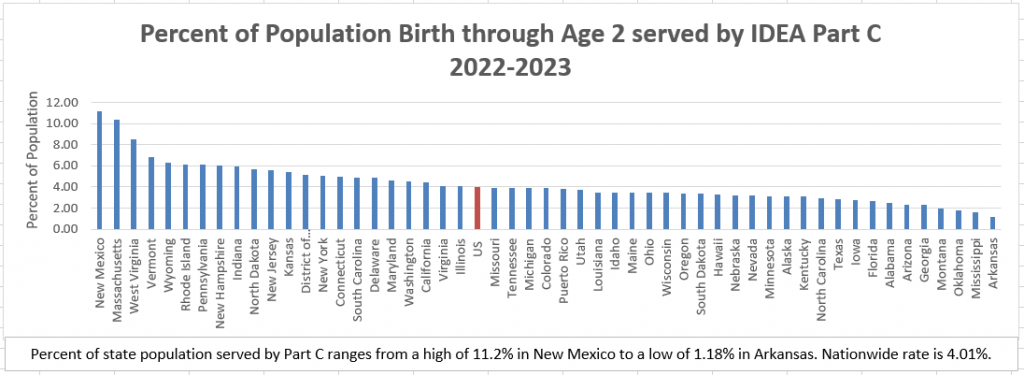
The percent of state population served by IDEA Part C varies across states from a high of 11.2% in New Mexico to a low of 1.18% in Arkansas. Nationwide rate is 4.01%.
The section 618 data collection provides data on the following
· School Year 2021-22 Part B Assessment
· School Year 2022-23 Part B Child Count and Educational Environments
· School Year 2021-22 Part B Discipline
· School Year 2021-22 Part B Dispute Resolution
· School Year 2021-22 Part B Exiting
. School Year 2021-22 Maintenance of Effort Reduction and Coordinated Early Intervening Services
· School Year 2021-22 Part B Personnel
· School Year 2022-23 Part C Child Count and Settings
· School Year 2021-22 Part C Dispute Resolution
· School Year 2021-22 Part C Exiting