Little Improvement in States’ Implementation of IDEA Part B in 2017

June 28th, 2019

June 28, 2019

The U.S. Dept. of Education’s Office of Special Education Programs (OSEP) has released the state determination letters for FFY 2017. These annual determinations are required by IDEA as part of OSEP’s monitoring and enforcement responsibilities. The process for making the annual determinations changed significantly in 2014 when OSEP initiated Results Driven Accountability (RDA) which added several “results” elements in an attempt to raise the achievement of students with disabilities. The RDA process is explained in our November 2018 report, Results Driven Accountability Needs Substantial Intervention.

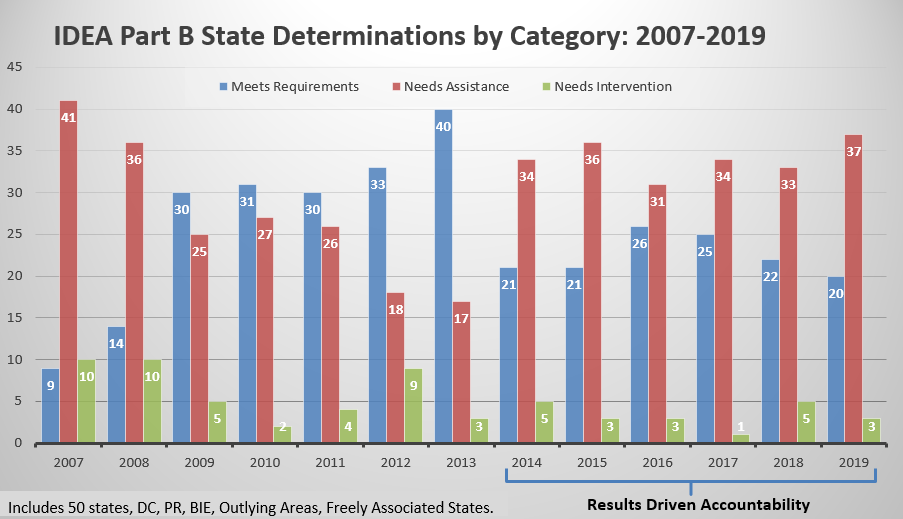
In the 6 years of state determinations using RDA (2014-2019), states have made little to no progress in improving their ratings. As the chart below clearly shows, this latest round of ratings puts a record number of states in the “Needs Assistance” category at 37 and the lowest number of states in the “Meets Requirements” category at 20.

IDEA Part B State Determinations 2007-2019

Some key findings of the 2019 determinations (for FFY 2017):

  • Only 8 states have achieved a “Meets Requirements” rating for all of the 6 years under RDA (KS, MA, MN, MO, NE, PA, VA, WI). These states educate just slightly more than 1 million of the nation’s 6.2 million students with disabilities ages 6-21. In other words, just 17 percent of the nation’s students with disabilities are receiving special education services in states that deliver results.
  • Most of the states serving the largest numbers of students with disabilities are rated as “Needs Assistance” (CA, IL, NY, TX). These 4 states serve 30 percent of the nation’s students with disabilities.
  • From 2018 to 2019:
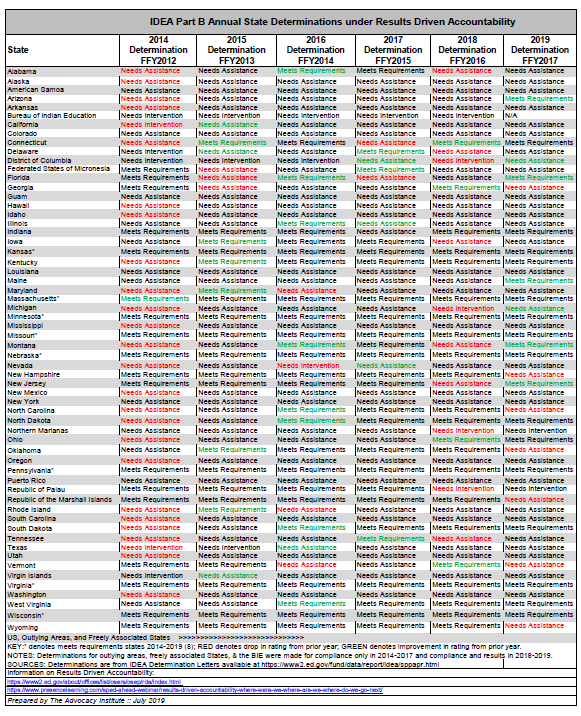
    • Seven states’ rating went down from “Meets Requirements” to “Needs Assistance” (GA, NH, NC, OK, VT, WY  and the Marshall Islands).
    • Seven states improved their rating from “Needs Intervention” to “Needs Assistance” (DC, MI) or from “Needs Assistance” to “Meets Requirements” (AZ, FL, ME, MT, NJ).

The table below shows the RDA ratings by state. Download the table here (PDF). Details for each state’s determination are available here.

RDA state determinations 2014-2019

In issuing the 2019 state determinations, OSEP has announced several changes that are being considered for the next round of determinations in 2020.

“The Secretary is considering modifying the factors the Department will use in making its determinations in June 2020 as part of its continuing emphasis on results for children with disabilities. Section 616(a)(2) of the IDEA requires that the primary focus of IDEA monitoring must be on improving educational results and functional outcomes for all children with disabilities, and ensuring that States meet the IDEA program requirements, with an emphasis on those requirements that are most closely related to improving educational results for children with disabilities.

The Part B proposed determinations process will include the same compliance factors as in past years, with one addition. For the 2020 determinations, rather than weighting each compliance factor equally, OSEP is considering assigning greater weight to those compliance factors most directly related to improving results for children with disabilities. For the 2020 determinations process we are also considering, as two additional results factors, State-reported data on: preschool child outcomes and the State Systemic Improvement Plan (SSIP). Using preschool outcomes for Part B determinations is consistent with the use of the early childhood outcomes factor that has been used for Part C determinations since 2015. Use of this factor emphasizes the importance of preschool outcomes in promoting later school success for students with disabilities. The inclusion of the SSIP as a results factor in making determinations would continue OSEP’s emphasis on incorporating a results-driven approach as States identify evidence-based practices that lead to improved outcomes for children and youth with disabilities. In addition, we are considering several changes to the results factors related to the participation and performance of children with disabilities on assessments, including: (1) using Statewide assessment results, rather than the NAEP performance data; (2) looking at year-to-year improvements in Statewide assessment results and taking into account the full Statewide assessment system, including alternate assessments; and (3) no longer comparing each State’s assessment performance with that of other States. Finally, OSEP will be revisiting ways of measuring improvement in the graduation rate of students with disabilities. As we consider changes to how we use the data under these factors in making the Department’s 2020 determinations, OSEP will provide parents, States, entities, LEAs, and other stakeholders with an opportunity to comment and provide input through OSEP’s Leadership Conference in July 2019 and other meetings.”

We are pleased to see that several of the proposed changes will address many (but not all) of the issues put forth in our report, Results Driven Accountability Needs Substantial Intervention, and look forward to receiving more details about the changes as well as an opportunity to provide comments to OSEP.


State-by-State Graduation Rates for Students with Disabilities 2016-2017

January 29th, 2019

States are required to report annually to the U.S. Dept. of Education (ED) the “4-Year Adjusted Cohort Graduation Rate (ACGR)” for all students and separately for many student subgroups, including students with disabilities. The ACGR was put into place in 2008 via Federal regulations to help bring uniformity to the way states calculate the high school graduation rate. Reporting began with the 2010-2011 school year. The ACGR was subsequently included in the Every Student Succeeds Act (ESSA) passed in 2015. It is also the subject of non-regulatory guidance released by ED in January 2017.

States are to report only those students who graduated with a “regular high school diploma” in four (or fewer) years. ESSA defines a “regular high school diploma” as the “standard high school diploma awarded to the preponderance of students in a State that is fully aligned with the State’s standards.”

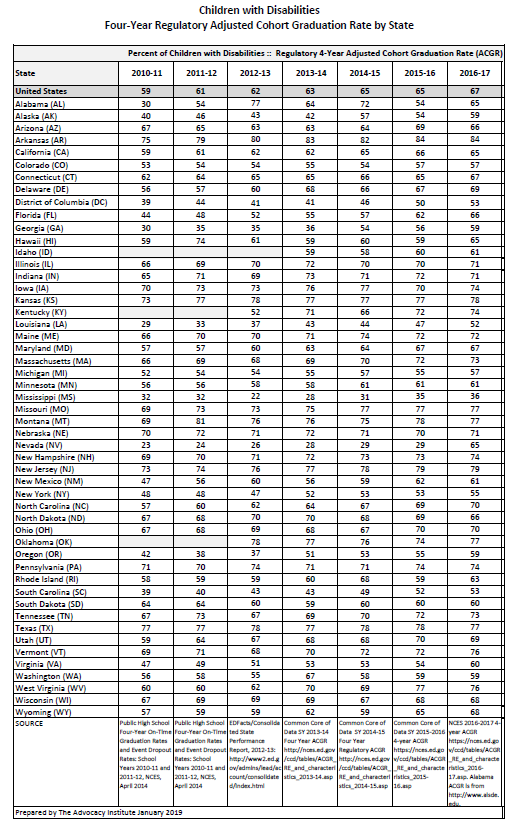
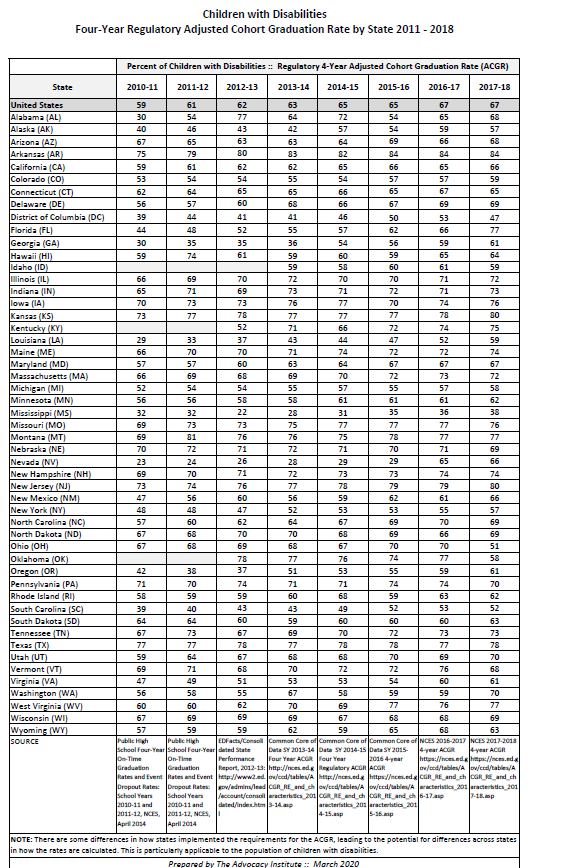
The 4-Year ACGR for the 2016-2017 school year was released on January 24, 2019. Below is a report on the performance of students with disabilities during the seven years since ACGR reporting began. The ED guidance makes these important points regarding the ACGR for students with disabilities:

  • A State may not include a recognized equivalent of a diploma as a regular high school diploma for the purpose of calculating the four-year or extended-year ACGR. (ESEA section 8101(43)(B)). Thus, students who graduate with a credential other than a regular high school diploma, such as a general equivalency diploma, modified diploma, certificate of completion, certificate of attendance, or a diploma based on meeting a student’s IEP goals, may not be counted in the numerator as having earned a regular high school diploma, but must be included in the denominator of the four-year and extended-year ACGR. (A-14) A diploma based on meeting IEP goals will not provide a sufficient basis for determining that the student has met a State’s grade-level academic content standards; rather, it will only demonstrate that the student has attained his or her IEP goals during the annual period covered by the IEP. Therefore, a diploma based on attainment of IEP goals, regardless of whether the IEP goals are fully aligned with a State’s grade-level content standards, should not be treated as a regular high school diploma.(A-15)
  • States may count a student with the most significant cognitive disabilities who graduates with a State-defined alternate diploma in the cohort for a four-year ACGR within the time period for which the State ensures the availability of a free appropriate public education under section 612(a)(1) of the Individuals with Disabilities Education Act (IDEA)(A-7)

However, because the U.S. Congress invalidated the Federal regulations governing accountability under ESSA, some issues regarding the calculation of the ACGR remain unsettled. These include:

  • How states determine who is a “student with a disability” for inclusion in the subgroup. Therefore, states may be determining who is included in a variety of ways (started the cohort with an IEP, exited the cohort  with an IEP, etc.) This lack of clarity impacts the comparability of the ACGR for students with disabilities across states.
  • How states count students with the most significant cognitive disabilities who graduate with a State-defined alternate diploma in the four-year and extended-year ACGR. Therefore, states may be using different methodologies for this purpose.

In comparing ACGRs across states, the substantial differences in the requirements for a regular high school diploma used by states must also be taken into consideration. A 2015 report by the National Center on Educational Outcomes examined the coursework and exit exam requirements for students with IEPs compared to those without IEPs. However, many states have made changes to their diploma requirements since this report was compiled. In other words, a regular high school diploma (as defined by ESSA) does not represent the same knowledge and skills across states nor does it necessarily indicate college and career readiness.

The ACGR plays an important role in the accountability plans that states are required to develop and implement required by ESSA. States must set long-term goals and measurements of interim progress for the ACGR including by subgroups.

4-year ACGR for Students with Disabilities 2010-2016

Download this chart here (PDF)

States reporting an ACGR more than 5 percentage points different (higher/lower) than the prior year for any subgroup are asked to provide an explanation for the increase/decrease to ED. The information submitted by such states appears at the end of this report.

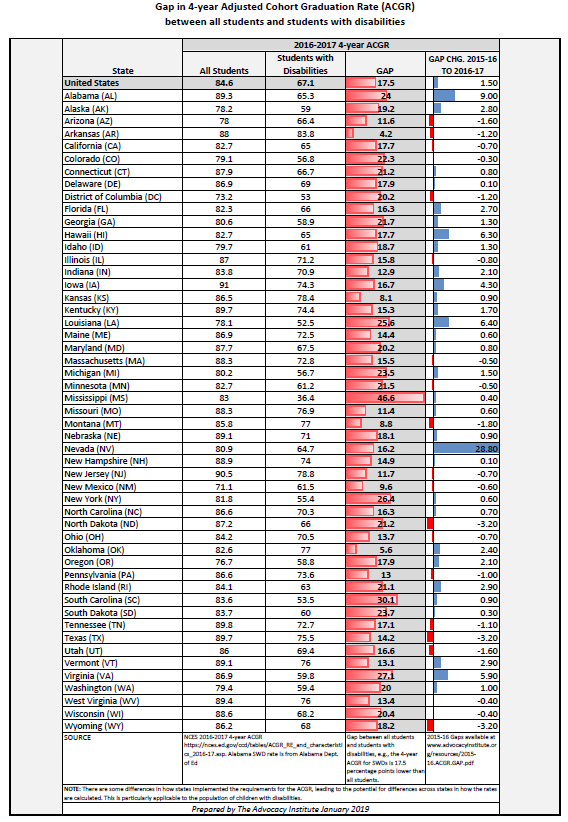
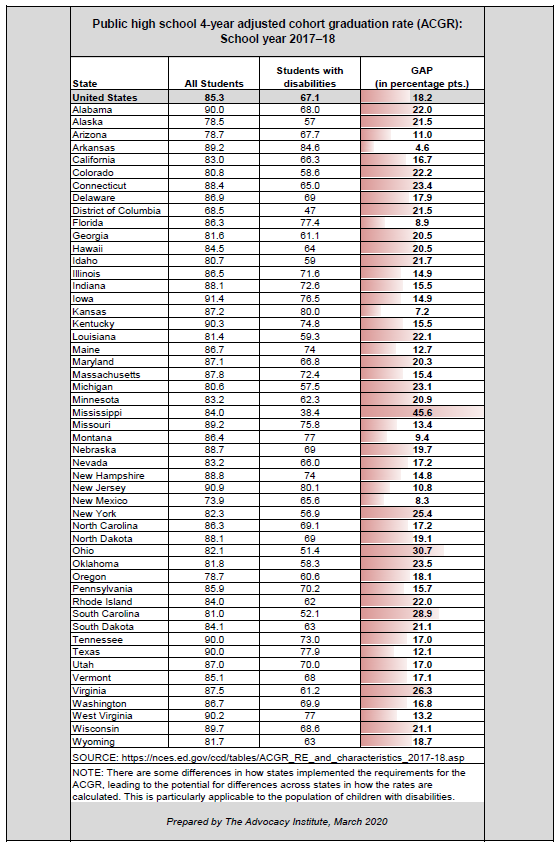
GAPS MATTER. While ACGR comparisons across states are difficult due to the issues discussed above, what is worth scrutiny is the GAP between students with disabilities and all students on the 4-year ACGR within each state. The table below provides the GAP for 2016-17 as well as the change in the GAP from the previous year. (Keep in mind that the GAP would be larger if it were possible to compare students with disabilities to those without disabilities.)

Gap between all students and students with disabilities 2016-17 ACGR

Download this chart here (PDF)

Below are the explanations provided to ED by states with substantial increase in their ACGR for students with disabilities from 2015-16 to 2016-2017 (excerpted from the ACGR Data Notes at https://www2.ed.gov/about/inits/ed/edfacts/data-files/index.html#acgr). LEA and school level ACGR data are also available.

Alabama: Alabama did not report ACGR data to ED for several subgroups including students with disabilities nor did the state respond to ED’s inquiry regarding the substantial difference in graduation rate for many subgroups including students with disabilities. After a review of its data, Alabama announced a revised graduation rate. See this news story.

Alaska: Alaska’s requirement that all graduates receive a valid score on a College and Career Ready Assessment was repealed on June 30, 2016. Graduation rates may have increased more than expected due to the elimination of this requirement.

Florida: The state indicated that data were correct as reported.

Hawaii: The state indicated that data were correct as reported.

Louisiana: No response

Nevada: The degree to which the change in graduation rate requirements caused the dramatic increase in rates across the state and within subgroups is difficult to accurately attribute as increase could also be the result of education reform initiatives enacted over the past several years. This being said, one policy action by the SEA is likely to have contributed significantly to the increase. This change was that students in the class of 2017 were the first students who did not have to earn a passing score on a high school state assessment for over a decade.

As the NDE considered a policy change for requirements to earn a regular high-school diploma, an analysis was conducted of the graduation rate trends for subpopulations. For students with disabilities, the graduation rate with a regular diploma had grown incrementally from 23% in FFY2005 to 28% in FFY2014. When students with disabilities were unable to pass each section of the high-stakes graduation examination, despite earning required credits, they earned adjusted diplomas. Adjusted diplomas accounted for approximately 32% of diplomas issued. After the policy was changed to no longer require students to pass a high-stakes examination to earn a regular diploma, there was an increase in the rate of students with disabilities earning a regular diploma that was comparable to the rate of students who previously earned adjusted diplomas. These data support an inference that the growth in the regular diploma graduation rate for students with disabilities is the result of the policy change to no longer require students to pass a high-stakes examination.

Virginia: The divisions that increased had more standard and advanced diplomas (which count towards the federal graduation rate), and the ones that decreased had an increase in dropouts.

Related articles:

Graduation Rates for Students with Disabilities: 6 Years (2010-2015)

Graduation Gaps for Students with Disabilities: 2015-2016

Diploma Options, Graduation Requirements, and Exit Exams for Youth with Disabilities: 2017 National Study (National Center on Educational Outcomes, 2019)

Study Finds Wide Variation in Graduation Rates for Students with Disabilities; Little Relationship with Graduation Policies (2015)

Graduation Issues and Considerations for Students with Disabilities Webinar presented by The Advocacy Institute and the National Center on Educational Outcomes (archived recording) Webinar Handout (PDF)

Diplomas that Matter: Ensuring Equity of Opportunity for Students with Disabilities (Achieve, 2016)

Almost all students with disabilities are capable of graduating on time. Here’s why they’re not (Hechinger Report, 2017)


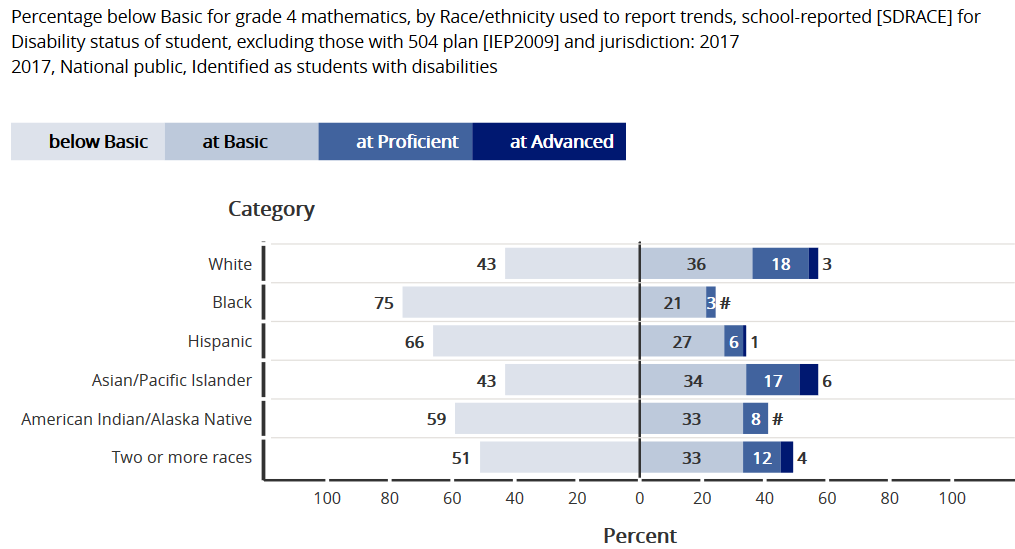
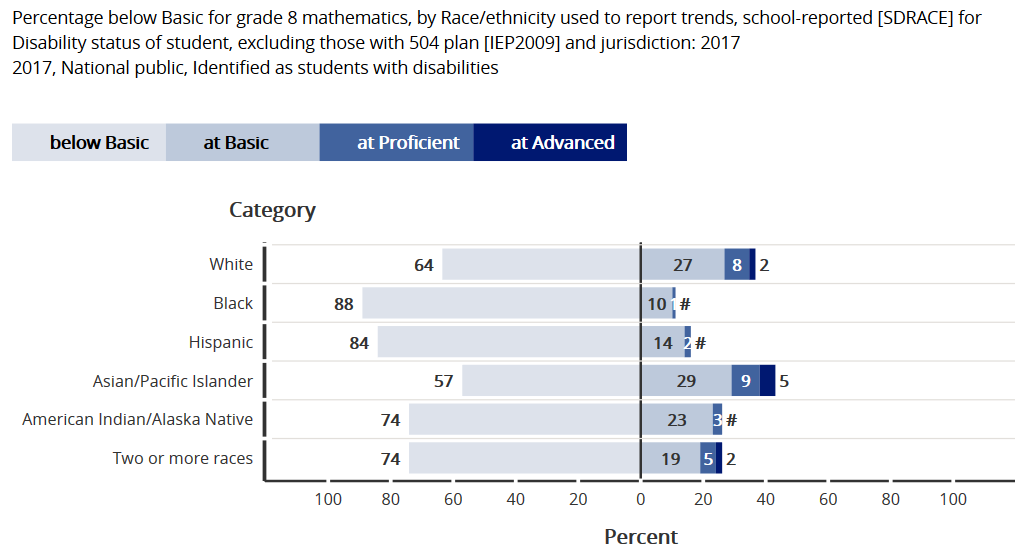
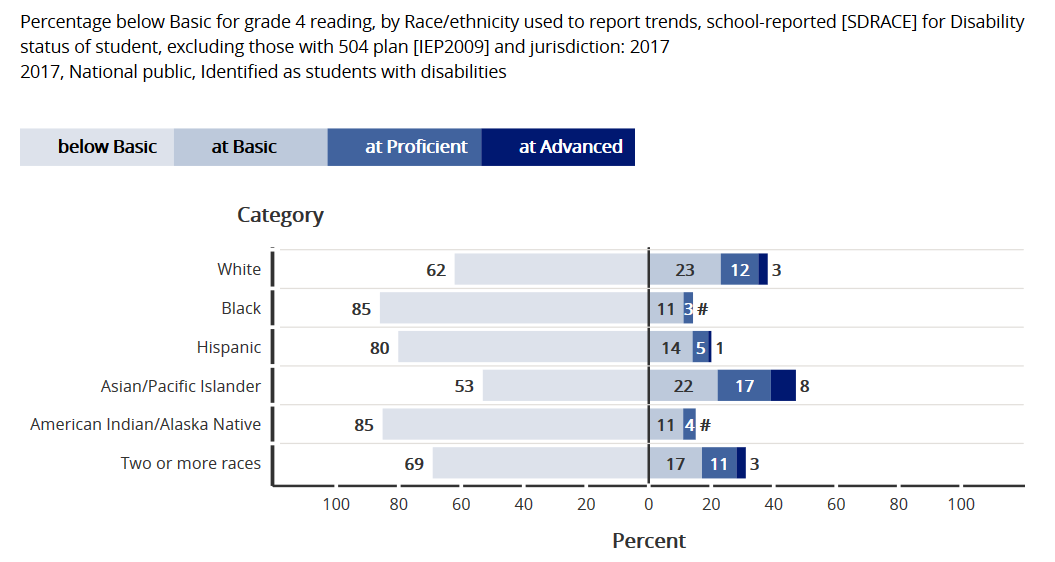
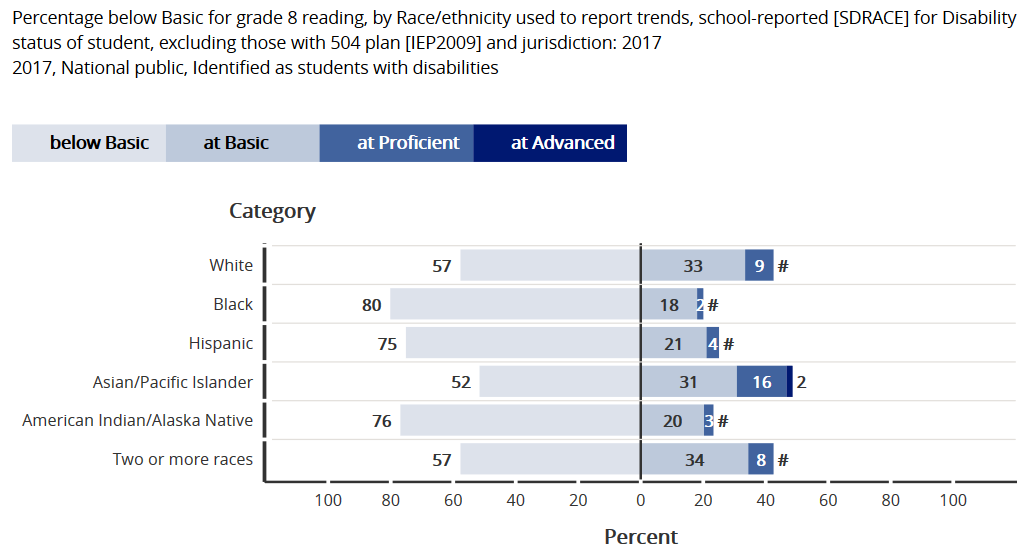
Examining 2017 NAEP achievement of students with disabilities by race/ethnicity

May 1st, 2018

Looking inside the 2017 NAEP results for students with disabilities (presented here) by race/ethnicity provides a gloomy picture.

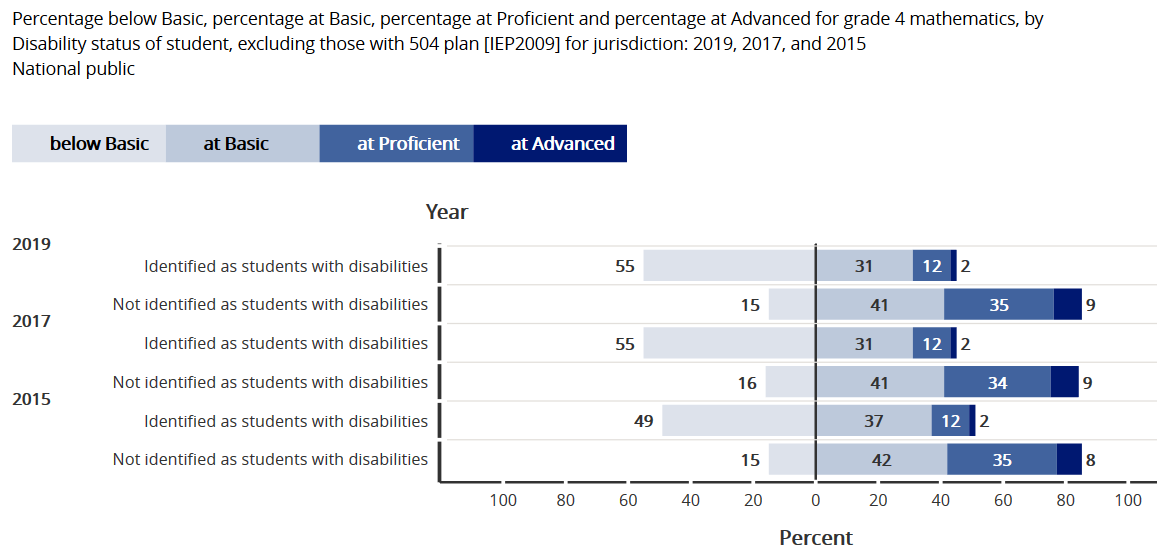
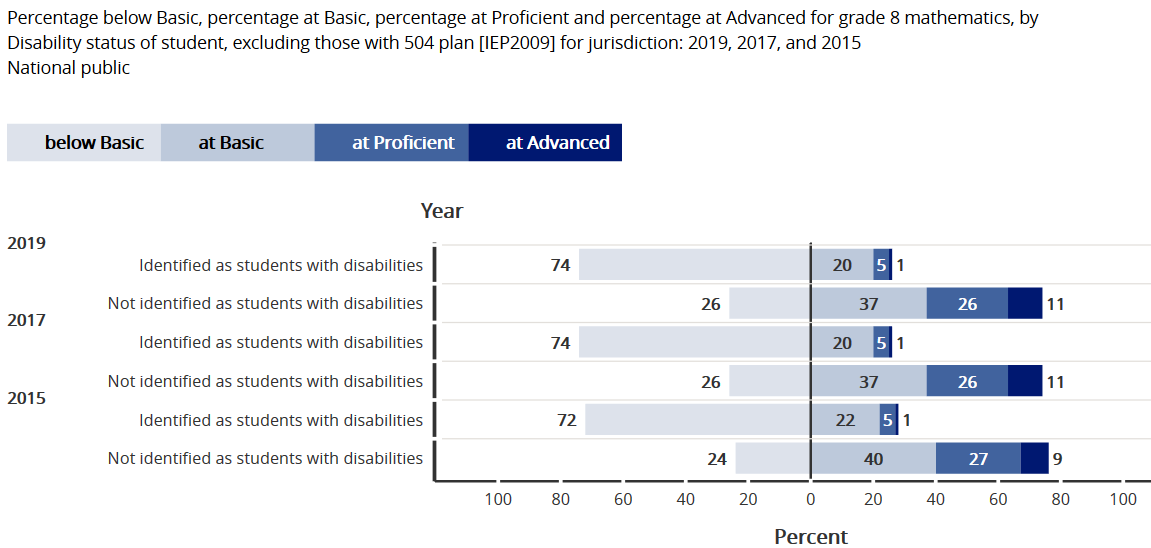
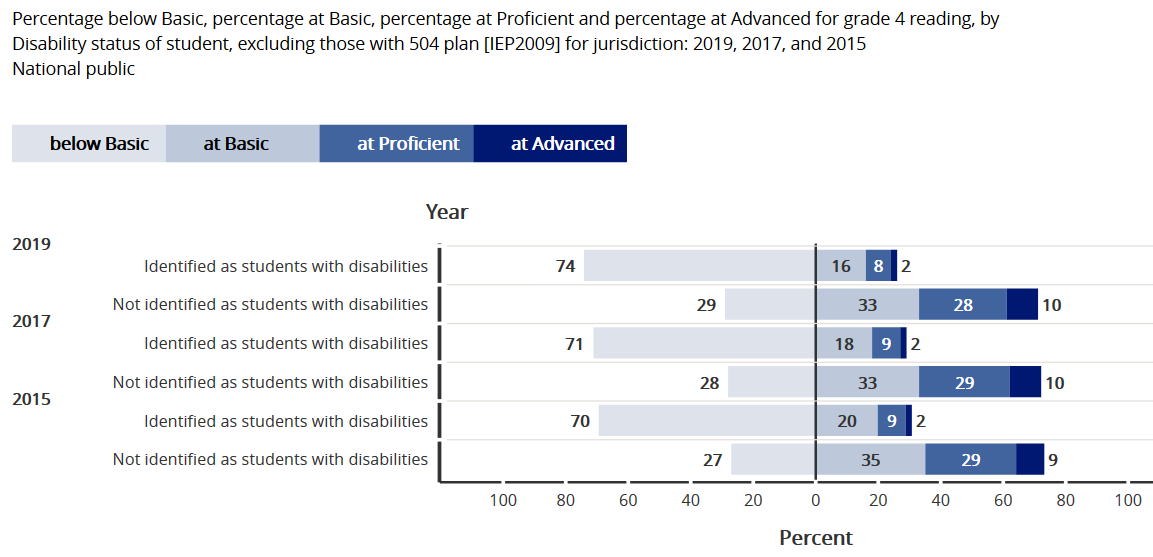
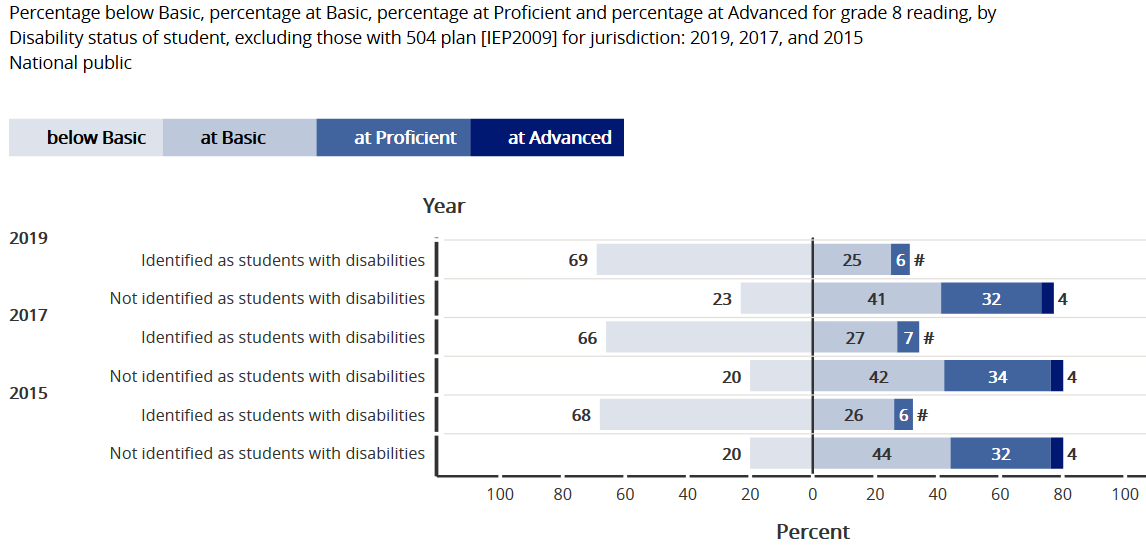
Below are results on 2017 NAEP assessments in math and reading by race/ethnicity.
(Learn more about the NAEP and students with disabilities.)

MATH GRADE 4


MATH GRADE 8

READING GRADE 4


READING GRADE 8


Source: https://www.nationsreportcard.gov/

2017 NAEP: Students with Disabilities Going Nowhere

April 12th, 2018

Results of the 2017 National Assessment of Educational Progress (NAEP) in mathematics and reading were released April 10, 2018. Details are available here.

NAEP mathematics and reading assessments are given every two years to a nationally representative sample of students in fourth and eighth grades. NAEP provides an important comparison across states and between student groups (e.g., female students, Hispanic students, students with disabilities).

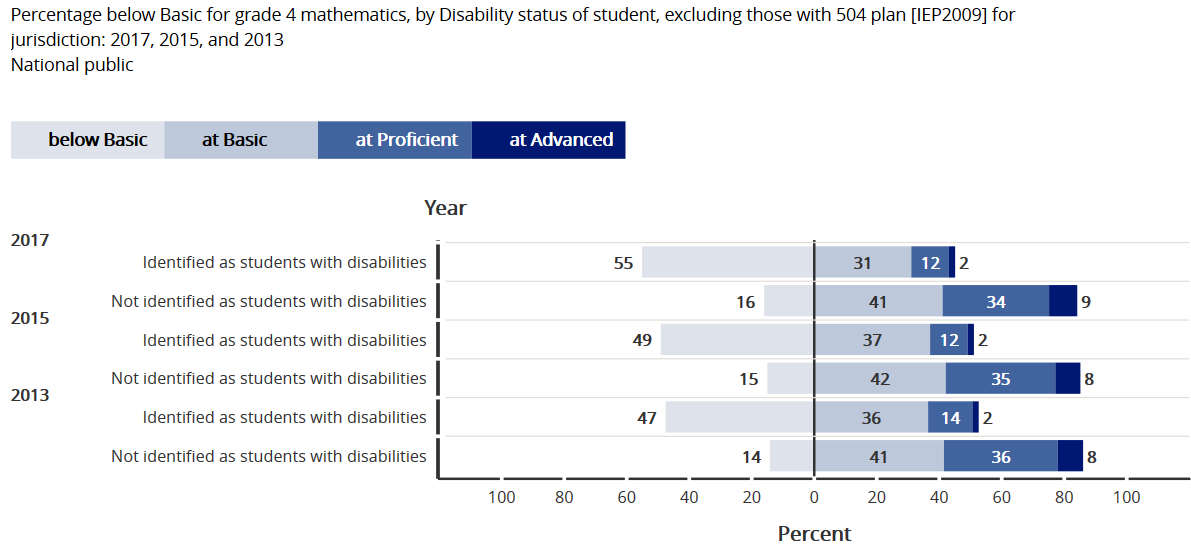
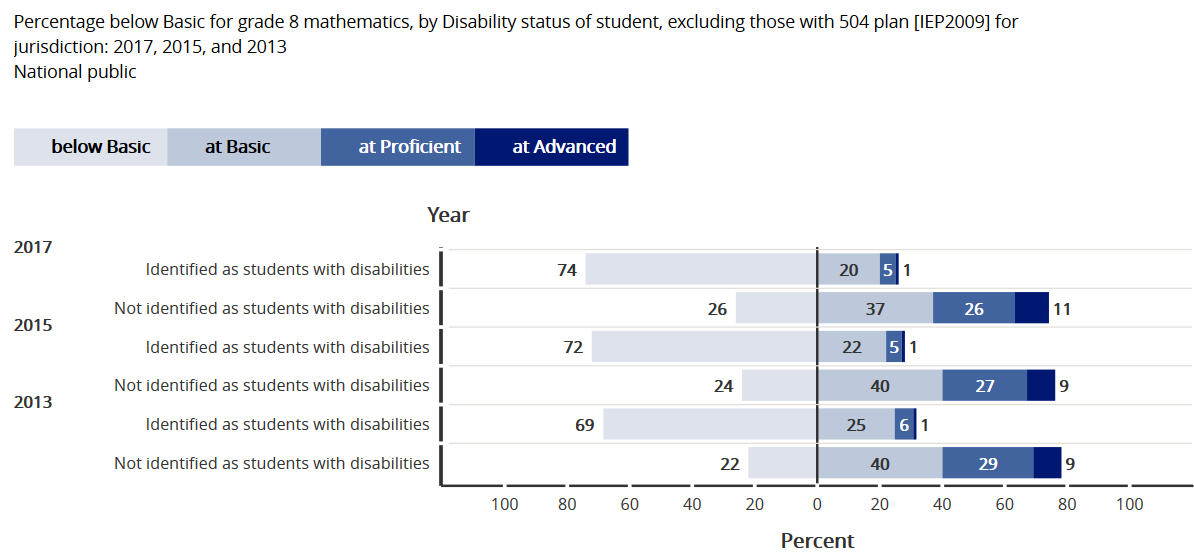
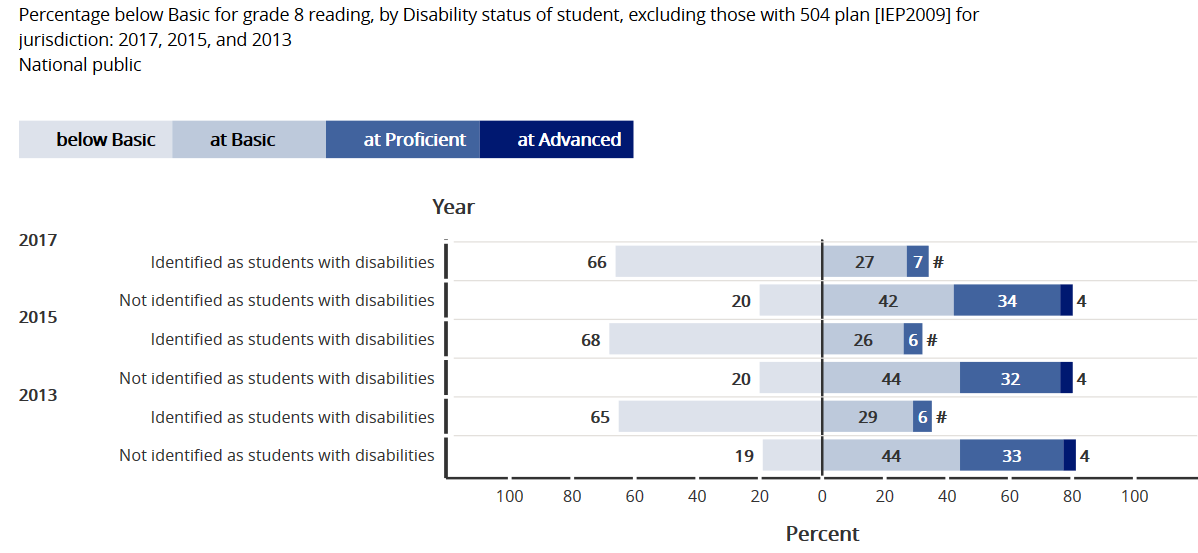
The 2017 achievement of students with disabilities showed virtually no improvement over 2015 (except 8th grade reading showed a slight improvement). In fact, the majority of students with disabilities performed in the “below basic” achievement level in all 4 areas (reading and math, 4th and 8th grade). The gaps between students with disabilities and those without disabilities continue to be substantial.

Importantly, NAEP includes students with 504 Plans in the overall results for students with disabilities. However, results can be filtered only for students with IEPs. We use results only for students with IEPs since these data are more useful in comparing student performance on state assessments and graduation rates – neither of which include students with 504 Plans.

In the coming weeks we will release state-by-state analyses of the achievement of students with disabilities compared to those without disabilities. Learn more about the NAEP and students with disabilities.

Below are the national results for students with IEPs compared to students without disabilities (public schools) for the most recent 3 NAEP administrations. (We also have national results for students with disabilities by race/ethnicity.)

MATH GRADE 4   (Click here for state-by-state below basic achievement and state-by-state basic and above achievement and the achievement of students with disabilities by race)

NAEP Math Grade 4 students with disabilities compared to students without disabilities 2013-2015-2017

MATH GRADE 8  (Click here for state-by-state below basic achievement and state-by-state basic and above achievement and the achievement of students with disabilities by race)

NAEP Math Grade 8 students with disabilities compared to students without disabilities 2013-2015-2017

READING GRADE 4  (Click here for state-by-state below basic achievement and state-by-state basic and above achievement and the achievement of students with disabilities by race)

NAEP Reading Grade 4 students with disabilities compared to students without disabilities 2013-2015-2017.

READING GRADE 8  (Click here for state-by-state below basic achievement and state-by-state basic and above achievement and the achievement of students with disabilities by race)

NAEP Reading Grade 8 students with disabilities compared to students without disabilities 2013-2015-2017

Source: https://www.nationsreportcard.gov/

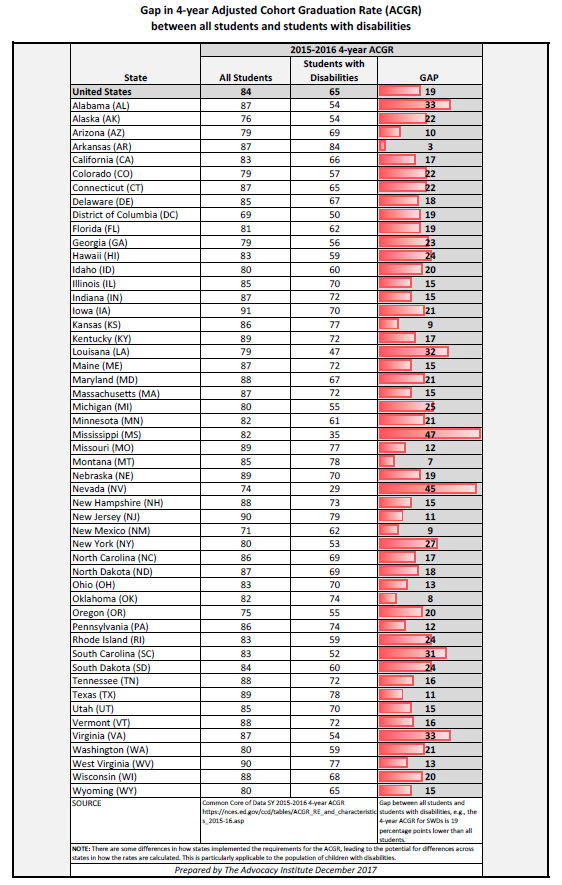
Graduation Rate Gaps :: 2015-2016

December 8th, 2017

Below is the graduation GAP between all students and students with disabilities by state for the 2015-2016 school year. Gaps range from a high of 47 percentage points in Mississippi to a low of 3 percentage points in Arkansas. A recap of the changes in the 4-year ACGR for students with disabilities by state from 2010 to 2015 is available here.

Download this table (PDF).

The complete 2015-2016 Four-Year Adjusted Cohort Graduation Rate (ACGR) is available here.

STATEMENT ON IMPLEMENTATION OF THE EVERY STUDENT SUCCEEDS ACT

July 15th, 2017

The Advocacy Institute released the following statement to the House Education and the Workforce Committee at its July 18, 2017 hearing on ESSA Implementation: Exploring State and Local Reform Efforts.

JULY 18, 2017

STATEMENT ON IMPLEMENTATION OF THE EVERY STUDENT SUCCEEDS ACT

The Advocacy Institute is watching with interest the implementation of the Every Student Succeeds Act (ESSA) with a particular focus on how the law’s new provisions can be used to improve services and outcomes for the nation’s 6 million students with disabilities. Our organization, in collaboration with the National Down Syndrome Congress, has reviewed more than 30 state plans (drafts or submitted) and provides detailed analyses at www.AdvocacyInstitute.org.

The purpose of ESSA—to provide all children significant opportunity to receive a fair, equitable, and high-quality education, and to close educational achievement gaps—can only be realized for students with disabilities if states and districts do the following:

  • Ensure the interests of students with disabilities are represented in all levels of planning and implementation in respectful, meaningful ways. Many states have not included representatives of students with disabilities in plan development activities.
  • Place a high level of both importance and urgency on improving results for historically underperforming groups of students in order to close achievement gaps. Students with disabilities are most frequently the lowest performing student group on state assessments and the National Assessment of Educational Progress (NAEP). Too many states seek to merely continue past trends or accelerate only slightly.
  • The improvement activities already underway through State Systemic Improvement Plans (SSIP) and the Results-Driven Accountability (RDA) initiative are integrated with ESSA plans and implementation. Few state ESSA plans reflect any coordination with the SSIP and RDA.
  • Adopt policies that ensure maximum accountability for performance of student groups. Key among these are establishing a minimum subgroup size (N-size) that ensures that, to the extent practicable, each subgroup of students is included at the school level for annual meaningful differentiation and identification of schools in need of improvement and rigorously enforcing the annual measurement of achievement requirement. Many states are adopting N-sizes that will leave far too many schools unaccountable for historically underperforming student subgroups and are not fully adhering to the requirements regarding annual measurement of achievement.

In addition, the U.S. Dept. of Education (ED) must continue to fulfill its critical role of monitoring ESSA planning and implementation through statutorily required Peer Review and Secretarial Approval. To date, ED interim feedback letters and peer review notes reflect valid finding in some respects but should be more consistent across states. Further, as this is within the Secretary’s authority, it should also scrutinize each plan for adherence to ESSA’s equity requirements.

###

See also: Statement from the National Down Syndrome Congress 

Response to AASA blog: “Reclaiming the LRE Debate from the Courts”

July 8th, 2016

In a recent blog for the American Association of School Administrators titled “Reclaiming the LRE Debate from the Courts” Associate Professor Susan C. Bon suggests a number of remedies for what she terms the “increasingly destructive and contentious disagreements over interpretation and implementation of the IDEA in public schools.” We take issue with those proposed remedies and offer our combined 100 plus years of teaching, research, teacher education, systems change, large-scale assessment, policy, and advocacy work as evidence of the experience we bring to bear on this issue.

Professor Bon’s remedies – which imply that more students with intellectual and other significant disabilities would be kept out of general education classes – ignore the 40 years of research on students with disabilities that show a positive correlation between time spent in a general education classroom and performance on standardized measures of reading and math, communication skills, social skills, engagement, breadth of social networks, pro-social behavior, fewer suspensions and expulsions, and enhanced adult outcomes in the areas of independent living, employment, and participation in inclusive community activities when compared to students educated in segregated environments (Beukelman & Mirenda, 2005; Cosier, Causton-Theoharis, & Theoharis, 2013; Guralnick, Connor, Hammond, Gottman, & Kinnish, 1996; Helmstetter, Curry, Brennan, & Sampson-Saul, 1998; Hunt, Farron-Davis, Beckstead, Curtis, & Goetz, 1994; White & Weiner, 2004). In fact, these research findings are encoded in the introductory paragraphs in IDEA 2004, where Congress finds “Almost 30 years of research and experience has demonstrated that the education of children with disabilities can be made more effective by having high expectations for such children and ensuring their access to the general education curriculum in the regular classroom, to the maximum extent possible.”

Professor Bon calls for giving precedence to the potential academic benefit of various educational placements when students’ IEPs are being written and to downplay the potential non-academic benefits. We argue that separating academic from non-academic benefits is contrary to the last 100 years of public education in the U.S. It has long been recognized that successful adulthood requires much more than proficiency in “the 3 R’s.” All students need to demonstrate proficiency in communication, collaboration, use of technology, social skills, self-determination, problem-solving and the like. To suggest that educational teams might be able to quantify the educational versus non-educational benefits to students with disabilities ignores our understanding of how children learn and what really matters when it comes to being a successful adult.

The example of the student with an IQ of 46 who is “mentally retarded” represents not only outdated and prejudicial terminology, but overestimates the importance of IQ in predicting educational achievement. A rationale for extreme caution in using a number like a student’s IQ score to guide his education program is supported by research on how well IQ scores predict student achievement. McGrew and Evans (2004) concluded:

Given the best available, theoretically and psychometrically sound, nationally standardized, individually administered intelligence test batteries, three statements hold true.

  • IQ test scores, under optimal test conditions, account for 40% to 50% of current expected achievement.
  • Thus, 50% to 60% of student achievement is related to variables “beyond intelligence.”
  • For any given IQ test score, half of the students will obtain achievement scores at or below their IQ score. Conversely, and frequently not recognized, is that for any given IQ test score, half of the students will obtain achievement scores at or above their IQ score. (p. 6)

Micah Fialka-Feldman, a subject of the trailer of a soon to be released documentary called Intelligent Lives by Dan Habib (producer of Including Samuel), was asked how he felt when he learned that he had a 40 IQ. He responded “Well, I didn’t know what it meant so I Googled it. It said that people with 40 IQs could never live alone, go to college, or be employed. And I thought “Well, I am doing all those things!” (Habib, 2016).

Another flawed remedy is Professor Bon’s recommendation that students with disabilities who need to have “assignments modified more than 70%” would not be able to obtain educational benefit from a general education class. Even with all of our years of experience we don’t understand what Professor Bon means here. Does she mean that 70% of the general education standards are modified?

Perhaps Professor Bon’s reference to modified assignments means that the number of math problems given for homework is reduced for a student with a disability. We all have known students with cerebral palsy, for example, for whom manipulation of a pencil or computer to do 30 problems is prohibitively laborious. Yet this student could demonstrate her knowledge of the concepts of the assignment by only doing five problems. Can that student not benefit from being in general education?

Maybe Professor Bon’s standard of 70% modified means that the complexity of an assigned reading is modified to a lower reading level? We know many students with significant reading disabilities whose skills are 70% below grade level, yet they are clearly able to benefit from being in general education when they are provided with supplementary aids and services in the form of assistive technology. Nor is there typically a debate or inquiry about whether it is appropriate to educate in the general education classroom other struggling learners, e.g., immigrant students whose formal education may have been interrupted, and who may or may not be English learners, or students who are educationally disadvantaged attending Title I schools.

Professor Bon suggests that greater weight be given to the effect that a student with a disability has on a general education classroom. Here we agree with Professor Bon if she is talking about the “value-added” benefits that students with disabilities provide to a general education class. Those added benefits have been shown to occur in the realms of improved academic skills of all students (Choi, Meisenheimer, McCart, & Sailor, 2016; Theoharis & Causton-Theoharis, 2010); improved decision-making skills (Zhang et al., 2016); and improved attitudes towards diversity (Finke, McNaughton, & Drager, 2009).

Finally, Professor Bon suggests that the current LRE mandate in IDEA be preserved in future reauthorizations – not based on the plain language of the statute but on a selective review of case law. We join with a growing number of colleagues who believe that the actual mandate – “to the maximum extent appropriate, children with disabilities … are educated with children who are not disabled, and special classes, separate schooling, or other removal of children with disabilities from the regular educational environment occurs only when the nature or severity of the disability of a child is such that education in the regular classes with the use of supplementary aids and services cannot be achieved satisfactorily” [20 U.S.C. §1412(a)(5)(A)] – has not been fairly and consistently applied for thousands of students with disabilities who are systematically kept out of general education classes, as evidenced by the huge geographic disparities in the misapplication of the statutory presumption to placement decision-making.

According to the 36th Annual Report to Congress on the Implementation of IDEA (U.S. Department of Education, 2014), the percent of students with intellectual disability educated at least 80 percent of the day in general education classes ranged from lows of 4.4 in Washington, 4.8 in New Jersey, and 5.5 in Nevada, and to highs of 64 in Iowa, 48.6 in Puerto Rico, and 45.5 in Alabama.

For students taking their respective state alternate assessments, Kleinert et al. (2015) found that students with the most significant cognitive disabilities face even greater segregation.  In a study involving 15 states and nearly 40,000 students, these researchers found that the vast majority (93%) of students with significant cognitive disabilities were served in self-contained classrooms, separate schools, or home settings, while only 7% were served in general education or resource room placements. Most importantly, these authors found a positive correlation between expressive communication, reading and math skill levels with increasingly inclusive classroom settings.  Being educated in the general education classroom does make a difference!

In summary, too many students are “still caught in the continuum” (Sauer & Jorgensen, 2016).  The time is long overdue to implement and enforce the plain language of the statute and for the U.S. Department of Education to eliminate those regulatory provisions that create straw men that serve only to undermine the statutory mandate, weaken the legal presumption, and camouflage continued discrimination on the basis of disability.

We agree with Professor Bon that the time and energy spent in litigation between parents and educators might be better spent on teaching students. Our recommendations for making that happen, however, are radically different from hers. We support efforts to scale-up the use of universal design for learning principles to all classrooms. We support efforts to expand access to communication and assistive technology to all students who need it. And we support school improvement and restructuring efforts that align with those funded by the U.S. Department of Education to the University of Kansas’ SWIFT project, including greater family and community engagement, strong administrative leadership, multi-tiered systems of supports used with fidelity, values- and evidence-based inclusive policy and practice, and integration of all support services for the benefit of all students.

These remedies won’t widen the gap between parents and schools but rather unite them in a common purpose founded on a belief that “inclusion is not about disability, nor is it only about schools. Inclusion demands that we ask, what kind of world do we want to create? What kinds of skills and commitment do people need to thrive in diverse society? By embracing inclusion as a model of social justice, we can create a world fit for all of us (Sapon-Shevin, 2003).”

Sincerely,

Cheryl M. Jorgensen, Ph.D., Inclusive Education Consultant, Author, Researcher

Kathleen B. Boundy, Co-Director, Center for Law and Education

Harold Kleinert, Ed. D., Director Emeritus, Institute for Human Development, University of Kentucky

Ricki Sabia, Senior Education Policy Advisor, National Down Syndrome Congress

Candace Cortiella, Director, The Advocacy Institute

References

Beukelman, D., & Mirenda, P. (2005). Augmentative and alternative communication: Supporting children and adults with complex communication needs (3rd ed.) Baltimore: Paul H. Brookes.

Choi, J. H., Meisenheimer, J. M., McCart, A. B., & Sailor, W. (2016). Improving learning for all students through equity-based inclusive reform practices: effectiveness of a fully integrated schoolwide model on student reading and math achievement. Remedial and Special Education [online], 1-14. doi: 10.1177/0741932516644054

Cosier, M., Causton-Theoharis, J., & Theoharis, G. (2013). Does access matter? Time in general education and achievement for students with disabilities. Remedial and Special Education, 34(6), 323-332.

Finke, E.H., McNaughton, D.B., & Drager, K.D. (2998). ‘All children can and should have the opportunity to learn”: General education teachers’ perspectives on including children with autism spectrum disorder who require AAC. Augmentative and Alternative Communication, 25(2), 110-122.

Guralnick, M. J., Connor, R., Hammond, M., Gottman, J. M., & Kinnish, K. (1996). Immediate effects of mainstreamed settings on the social interactions and social integration of preschool children. American Journal on Mental Retardation, 100, 359-377.

Habib, D. (Producer). (2016). Intelligent lives [Motion Picture Trailer] Durham, NH: University of New Hampshire, Institute on Disability.

Helmstetter, E., Curry, C. A., Brennan, M., & Sampson-Saul, M. (1998). Comparison of general and special education classrooms of students with severe disabilities. Education and Training in Mental Retardation and Developmental Disabilities, 33, 216-227.

Hunt, P., Farron-Davis, F., Beckstead, S., Curtis, D., & Goetz, L. (1994). Evaluating the effects of placement of students with severe disabilities in general education versus special classes. Journal of the Association for Persons with Severe Handicaps, 19, 200-214.

Individuals with Disabilities Education Improvement Act, PL 108-446, 20 U.S.C. §§1400 et seq. (2004).

Kleinert et al., (2015). Where students with the most significant cognitive disabilities are taught: Implications for general curriculum access.  Exceptional Children, 81(3), 312-328.

McGrew, K. S., Evans, J. (2004). Expectations for students with cognitive disabilities: Is the cup half empty or half full? Can the cup overflow? (Synthesis Report 54). Minneapolis: University of Minnesota, National Center on Educational Outcomes.

Sapon-Shevin, M. (2003). Inclusion as a matter of social justice. Educational Leadership, 61(2), 25-28.

Theoharis, G., & Causton-Theoharis, J. (2010) Include, belong, learn. Educational Leadership, 68(2). Retrieved from http://www.ascd.org/publications/educational-leadership/oct10/vol68/num02/Include,-Belong,-Learn.aspx

U.S. Department of Education. (2014). Thirty-sixth annual report to Congress on the implementation of the Individuals with Disabilities Education Act, 2013. Retrieved from http://www2.ed.gov/about/reports/annual/osep/2013/parts-b-c/index.html

White, J., & Weiner, J. S. (2004). Influence of least restrictive environment and community based training on integrated employment outcomes for transitioning students with severe disabilities. Journal of Vocational Rehabilitation, 21(3), 149-156.

Zhang, X., et al. (2016). Improving children’s competence as decision makers: Contrasting effects of collaborative interaction and direct instruction. American Educational Research Journal, 53, 194-223. doi: 10:3102/0002831215618663
 

TUDA Spells Tough Times for Students with Disabilities in Many Large Urban Districts

October 30th, 2015

Along with the results of the 2015 NAEP for states and the nation, the results of the 2015 TUDA – the Trial Urban District Assessment were released on October 28, 2015. (We blogged about the release of the NAEP at the state and national levels earlier.)

The TUDA reports the reading and math achievement of public school students in 21 urban districts at grades 4 and 8. Results are broken down by racial/ethnic groups as well as special populations, such as students with disabilities and students eligible for free/reduced-price lunch meals. The TUDA was established in 2002 to support the improvement of student achievement in the nation’s large urban districts. Districts eligible to participate in the TUDA assessments must be large cities with a population of 250,000 or more in addition to having a majority (50 percent or more) of their student population being Non-White (Black or Hispanic) or eligible for the National School Lunch program. Students in the TUDA districts represent nearly one-half of the students who attend schools in large cities nationally.

The districts that participated in the 2015 TUDA are shown in the map below.

Districts participating in 2015 NAEP TUDA

Map reads: 2015 Participating Districts were Albuquerque, Atlanta, Austin, Baltimore City, Boston, Charlotte, Chicago, Cleveland, Dallas, Detroit, District of Columbia (DCPS), Duval County (FL), Fresno, Hillsborough County (FL), Houston, Jefferson County (KY), Los Angeles, Miami-Dade, New York City, Philadelphia and San Diego.

The achievement of students with disabilities (which includes students with IEPs and 504 Plans) varied substantially across the 2015 TUDAs. The nationwide achievement levels and the Large City achievement levels appear in the table below.

NAEP 2015 Achievement levels of students with and without disabilities nationwide and large city

HIGH PERFORMING DISTRICTS. When comparing the achievement of students with disabilities in the TUDAs to that of Large Cities, a few districts stand out as doing exceptionally well. In Reading, these districts are Duval County (FL), Hillsborough County (FL) and Miami-Dade (FL). In Math, these districts are Austin, Boston, Duval County (FL), Hillsborough County (FL) and Miami-Dade (FL).

POOR PERFORMING DISTRICTS. When comparing the achievement of students with disabilities in the TUDAs to that of Large Cities, a few districts stand out as exceedingly poor performers. In Reading, these districts are Albuquerque, Baltimore City, Cleveland, Detroit, Los Angeles, and Philadelphia. In Math, these districts are Albuquerque, Atlanta, Baltimore City, Chicago, Cleveland, Detroit, Fresno, Los Angeles, and Philadelphia.

The performance of students with disabilities compared to those without disabilities in each of the participating districts is shown below.

READING GRADE 4 (Click here to view this table as a chart)


TUDA 2015 Reading Grade 4 Students with Disabilities and students without disabilities

READING GRADE 8 (Click here to view this table as a chart)


TUDA Reading Grade 8 2015 students with disabilities and without disabilities

MATH GRADE 4 (Click here to view this table as a chart)


TUDA 2015 Math Grade 4 students with and without disabilities

MATH GRADE 8 (Click here to view this table as a chart)


TUDA 2015 Math Grade 8 students with and without disabilities


SEE ALSO: Blog on 2013 TUDA

2015 NAEP Shows Little Change for Students with Disabilities

October 29th, 2015

Results of the 2015 National Assessment of Educational Progress (NAEP) in Reading and Mathematics were released October 28, 2015. Details are available here.

As in recent years, the 2015 performance of students with disabilities showed little if any improvement over the last three administrations (2009-2011-2013) and the gaps between students with disabilities and those without disabilities continue to be substantial. The majority of students with disabilities performed in the “below basic” achievement level in all areas except 4th grade Math. See table below.

NAEP 2015 Achievement levels SD vs. No SD

However, there has been a substantial improvement in the rate of exclusion of students with disabilities, i.e., the percentage of students with disabilities selected to participate in the sample who were not tested. This practice was addressed by a resolution of the National Assessment Governing Board in 2010. The resolution sought to have students with disabilities participating at a rate of at least 85% in every state. As a result, exclusion rates have plummeted, as shown in the table below. This high rate of participation makes the NAEP results for students with disabilities more representative of the group as a whole. (Details on exclusion rates by state on each NAEP assessment are available here.)

NAEP participation was also addressed by the US ED Office of Special Education Programs in 2014 when it began including NAEP participation and performance in the determination for each State under section 616(d) of the Individuals with Disabilities Education Act (IDEA).

The table below shows the rates of exclusion in NAEP administrations from 2003-2015.

NAEP exclusion rates for students with disabilities

In fact, the significant improvement in testing students with disabilities was noted by U.S. Education Secretary Arne Duncan as possibly causing overall declines in Maryland, as reported in the Baltimore Sun “U.S. Secretary of Education Arne Duncan noted to Maryland and Baltimore’s large declines, but said the drops were “good news” because they reflected the state’s efforts to be more inclusive of certain populations — such as students with disabilities and English Language Learners.” 

Below are achievement levels for students with disabilities and students without disabilities in each NAEP area from 2003 through 2015.

READING – GRADE 4

NAEP Reading Grade 4 achievement levels for students with disabilities 2003-2015

READING GRADE 8

NAEP Reading Grade 8 achievement levels students with disabilities 2003-2015

 MATH GRADE 4

NAEP Math Grade 4 achievement levels students with disabilities 2003-2015

MATH GRADE 8

NAEP Math Grade 8 achievement levels students with disabilities 2003-2015


See also: Our reports on 2015 TUDA and 2013 NAEP results.

New ACGR Data Show Graduation Gaps Persist

October 21st, 2015

On October 19, 2015, the U.S. Dept. of Education (ED) released preliminary graduation rates reported by states for the 2013-14 school year.

According to ED “The vast majority of states – 36 – saw increases in overall graduation rates, while 6 states saw decreases and another 8 saw no change since 2012-13. The majority of states also shrank the achievement gap for black and Hispanic students, as well as students with disabilities, English language learners and low-income students”

ED reported that 21 states showed a decline in the graduation rate gap between all students and students with disabilities, 17 states had increases in the gap and 12 states showed no change.

Our analysis (below) found 21 states and D.C. decreased, 15 increased and 14 had no change (the difference could be caused by rounding). Two states are outliers  – Alabama (19 point gap increase) and Oregon (gap decrease of 11 points).

Most states had negligible changes (a decrease or increase of just 1-2 points) which could be characterized as statistically insignificant.

Without a doubt, the bigger issue continues to be the huge gaps between students with disabilities and all students earning a regular high school diploma in four years.

Four Year Adjusted Cohort Graduation Rate
Gaps between All Students and Students with Disabilities
SY 2012-13 and SY 2013-14

Download ACGR Comparison Chart .

See also: Study Finds Wide Variation in Graduation Rates for Students with Disabilities; Little Relationship with Graduation Policies