NAEP and Students with Disabilities: No where to go but up!
The results of the 2013 National Assessment of Educational Progress (NAEP) in Reading and Math were released today. Details are available here. User-friendly digital tools let you display results by state and student groups such as students with disabilities.
Sadly, the performance of students with disabilities has shown little if any improvement over the last three administrations (2009-2011-2013) and the gaps between students with disabilities and those without disabilities continue to be substantial.
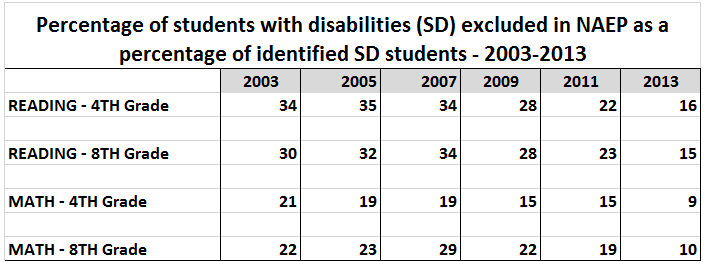
However, there has been a substantial improvement in the rate of exclusion of students with disabilities, i.e., the percentage of students with disabilities selected to participate in the sample who were not tested. This practice was addressed by a resolution of the National Assessment Governing Board in 2010. The resolution sought to have students with disabilities participating at a rate of at least 85% in every state. As a result, exclusion rates have plummeted, as shown in the table below. This high rate of participation makes the NAEP results for students with disabilities more representative of the group as a whole. However, high exclusion rates still exist in some states, such as California, Georgia and Maryland. Details on exclusion rates by state on each NAEP assessment are available here.
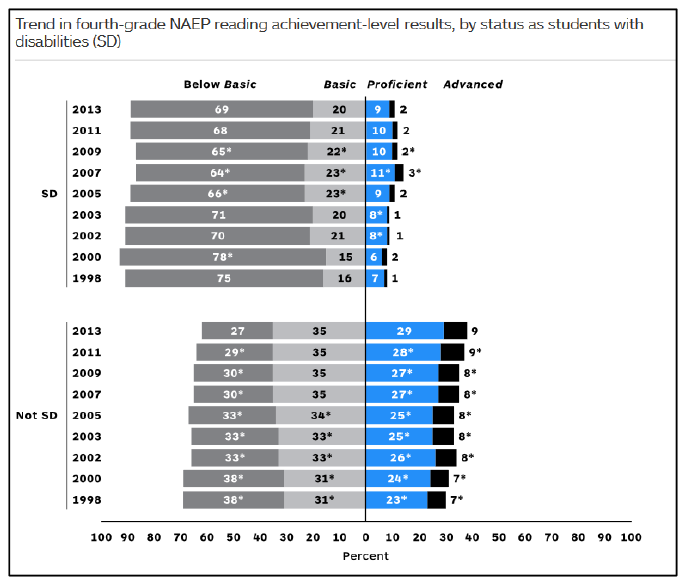
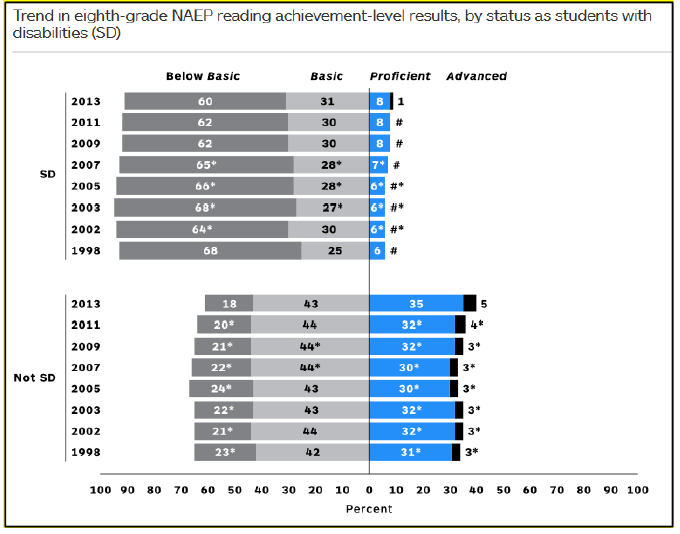
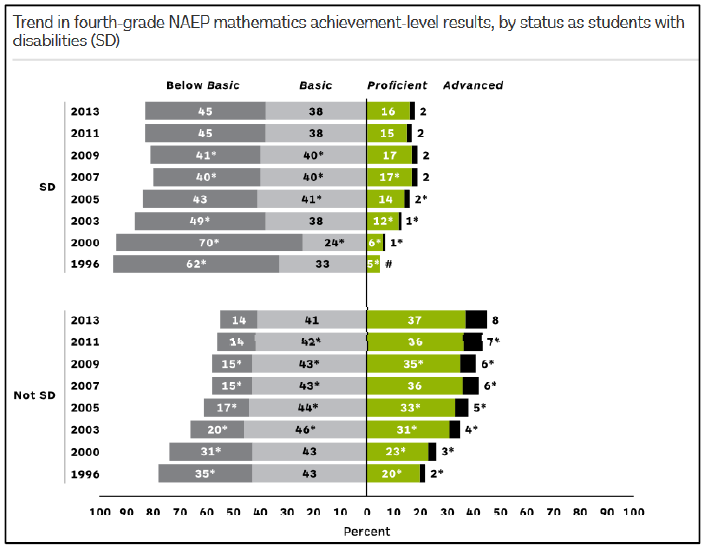
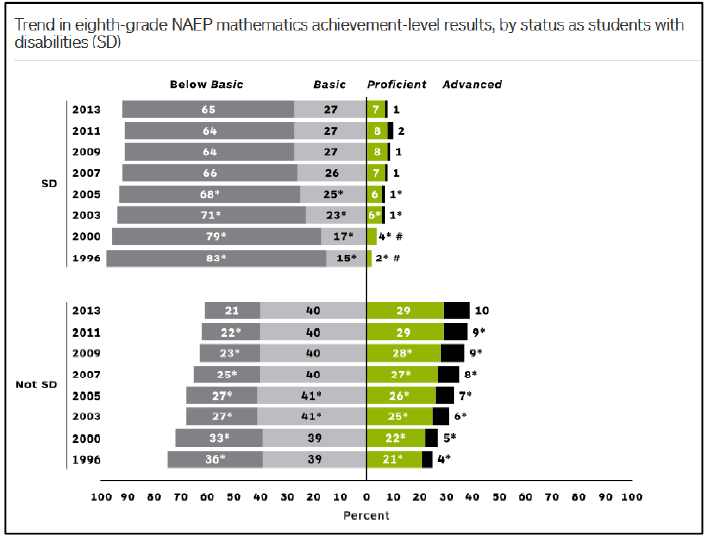
Turning to achievement, students with disabilities continue to perform poorly on all NAEP measures.
READING – 4TH GRADE:
READING – 8TH GRADE:
MATH – 4TH GRADE:
MATH – 8TH GRADE:
